Question:
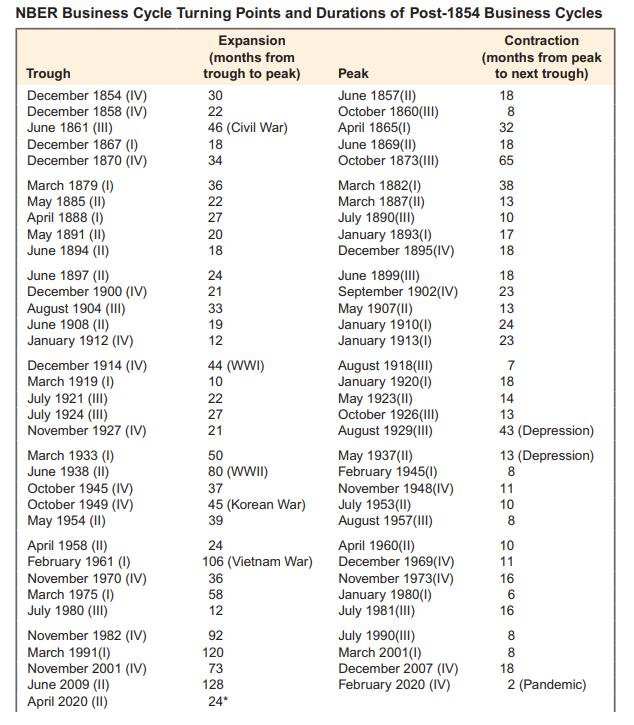
For each month since January 1960, calculate the share of total unemployment accounted for by people unemployed for 15 weeks or more. How is this ratio related to the business cycle (for peak and trough dates, see Table 8.1), and to the overall unemployment rate? What are the implications of these results for a policymaker who wants to assess the costs of a recession?
Table 8.1

Transcribed Image Text:
Expansion (months from Trough trough to peak) NBER Business Cycle Turning Points and Durations of Post-1854 Business Cycles Contraction (months from peak to next trough) Peak December 1854 (IV) December 1858 (IV) June 1861 (III) December 1867 (1) December 1870 (IV) March 1879 (1) May 1885 (II) 36 April 1888 (1) May 1891 (II) June 1894 (II) June 1897 (II) December 1900 (IV) 21 24 August 1904 (III) June 1908 (II) January 1912 (IV) December 1914 (IV) March 1919 (1) July 1921 (III) July 1924 (III) November 1927 (IV) March 1933 (1) June 1938 (II) October 1945 (IV) October 1949 (IV) 50 80 (WWII) 37 May 1954 (II) April 1958 (II) February 1961 (1) November 1970 (IV) March 1975 (1) July 1980 (III) November 1982 (IV) March 1991(1) November 2001 (IV) June 2009 (II) April 2020 (II) 120 128 8 30 22 June 1857(II) 18 October 1860(III) 8 46 (Civil War) April 1865(1) 32 18 34 June 1869(II) 18 October 1873(III) 65 March 1882(1) 38 22 March 1887(II) 13 27 July 1890(III) 20 January 1893(1) 18 December 1895(IV) June 1899(III) September 1902(IV) 33 May 1907(II) 19 January 1910(1) 12 January 1913(1) 44 (WWI) August 1918(III) 10 January 1920(1) 070 2222 70 10 17 18 18 23 13 24 23 18 22 May 1923(II) 14 27 October 1926(III) 13 21 August 1929(III) 43 (Depression) May 1937(II) 13 (Depression) February 1945(1) 8. November 1948(IV) 11 45 (Korean War) July 1953(II) 10 39 August 1957(III) 8 24 April 1960(II) 10 106 (Vietnam War) December 1969(IV) 11 36 November 1973(IV) 16 58 January 1980(1) 12 July 1981(III) 16 92 July 1990(III) 8 6600 March 2001(1) 8 73 December 2007 (IV) 18 February 2020 (IV) 2 (Pandemic) 24*


