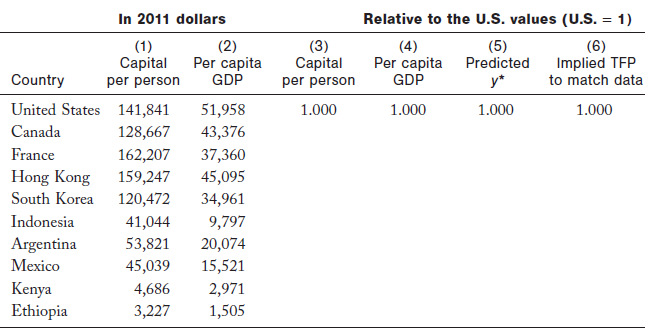
The table below reports per capita GDP and capital per person in the year 2014 for 10
Question:
(a) Given the values in columns 1 and 2, fill in columns 3 and 4. That is, compute per capita GDP and capital per person relative to the U.S. values.
(b) In column 5, use the production model (with a capital exponent of 1/3) to compute predicted per capita GDP for each country relative to the United States, assuming there are no TFP differences.
(c) In column 6, compute the level of TFP for each country that is needed to match up the model and the data.
(d) Comment on the general results you find.

Fantastic news! We've Found the answer you've been seeking!
Step by Step Answer:
Related Book For 

Question Posted:


