This problem asks you to do your own growth accounting exercise. Using data since 1960, make a
Question:
This problem asks you to do your own growth accounting exercise. Using data since 1960, make a table of annual growth rates of real GDP, the capital stock, and civilian employment. Assuming \(a_{K}=0.3\) and \(a_{N}=0.7\), find the productivity growth rate for each year.
a. Graph the contributions to overall economic growth of capital growth, labor growth, and productivity growth for the period since 1960. Contrast the behavior of each of these variables in the post-1973 period to their behavior in the earlier period.
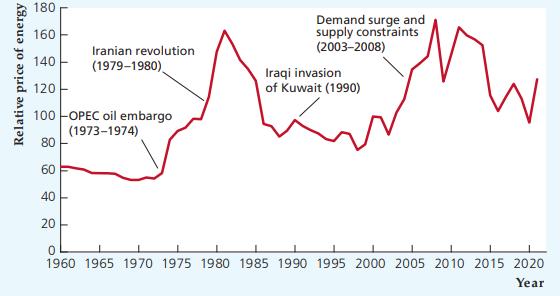
b. Compare the post-1973 behavior of productivity growth with the graph of the relative price of energy, shown in Fig. 3.11. To what extent do you think the productivity slowdown can be blamed on higher energy prices?
Fig. 3.11.

Step by Step Answer:


