

2. The figure below shows the supply curve for tennis balls, S1, for Drop Volley Tennis, a...
Question:
2. The figure below shows the supply curve for tennis balls, S1, for Drop Volley Tennis, a producer of tennis equipment. Use the figure and the table below to give your answers to the following questions. LO3.3
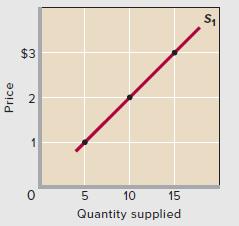
a. Use the figure to fill in the quantity supplied on supply curve S1 for each price in the following table.
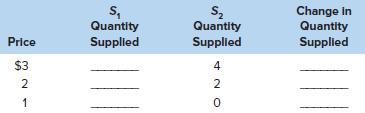
b. If production costs were to increase, the quantities supplied at each price would be as shown by the third column of the table (“S2 Quantity Supplied”). Use those data to draw supply curve S2 on the same graph as supply curve S1.
c. In the fourth column of the table, enter the amount by which the quantity supplied at each price changes due to the increase in product costs. (Use positive numbers for increases and negative numbers for decreases.)
d. Did the increase in production costs cause a “decrease in supply” or a “decrease in quantity supplied”?
Step by Step Answer:

This question has not been answered yet.
You can Ask your question!


Macroeconomics
ISBN: 9781259915673
21st Edition
Authors: Campbell McConnell, Stanley Brue , Sean Flynn
