

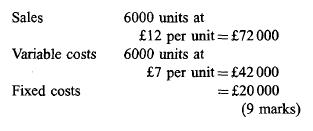
Break-even, contribution and profit- volume graph (a) From the following information you are required to construct: (i)
Question:
Break-even, contribution and profit- volume graph
(a) From the following information you are required to construct: (i) a break-even chart, showing the break- even point and the margin of safety; (ii) a chart displaying the contribution level and the profit level; (iii) a profit-volume chart..
(b) State the purposes of each of the three charts in
(a) above. (6 marks)
(c) Outline the limitations of break-even analysis. (5 marks)
(d) What are the advantages of graphical presen- tation of financial data to executives?
Step by Step Answer:

This question has not been answered yet.
You can Ask your question!
Related Book For 
Question Posted:
