

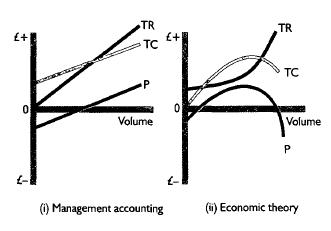
The graphs shown below show cost-volume-profit relationships as they are typically represented in (i) management accounting and
Question:
The graphs shown below show cost-volume-profit relationships as they are typically represented in (i) management accounting and (ii) economic theory. In each graph TR = total revenue, TC= total cost, and P profit. You are required to compare these different representations of cost-volume-profit relationships, identifying, explaining and com- menting on points of similarity and also differ- ences. (15 marks) ICAEW
Step by Step Answer:

This question has not been answered yet.
You can Ask your question!
Related Book For 

Question Posted:
