Advanced: CVP analysis and decision-making including a graphical presentation In the last quarter of 1985/86 it is
Question:
Advanced: CVP analysis and decision-making including a graphical presentation In the last quarter of 1985/86 it is estimated that YNQ will have produced and sold 20 000 units of their main product by the end of the year. At this level of activity it is estimated that the average unit cost will be:
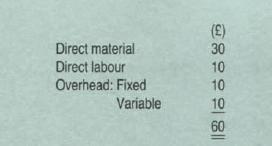
This is in line with the standards set at the start of the year. The management accountant of YNO is now preparing the budget for 1986/87. He has incorporated into his preliminary calculations the following expected cost increases:
Raw material: price increase of 20%
Direct labour: wage rate increase of 5%
Variable overhead: increase of 5%
Fixed overhead: increase of 25%
The production manager believes that if a cheaper grade of raw material were to be used. this would enable the direct material cost per unit to be kept to £31.25 for 1986/87. The cheaper matenal would. however, lead to a reject rate estimated at 5% of the completed output and it would be necessary to introduce an inspection stage at the end of the manufacturing process to identify the faulty items. The cost of this inspection process would be £40000 per year (including £10000 allocation of existing factory overhead).
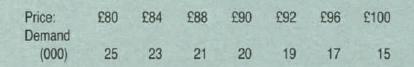
Established practice has been to reconsider the product's selling price at the time the budget is being prepared. The selling price is normally determined by adding a mark-up of 50% to unit cost On this basis the product's selling price for 1985/86 has been £90 but the sales manager is worried about the implications of continuing the cost-plus 50% rule for 1986/87. He estimates that demand for the product varies with price as follows:
(a) You are required to decide whether YNQ should use the regular or the cheaper grade of material and to calculate the best price for the product, the optimal level of production and the profit that this should yield. Comment briefly on the sensitivity of the solution to possible errors in the estimates.
(14 marks)
(b) Indicate how one might obtain the answer to part
(a) from an appropriately designed cost-volume-profit graph. You should design such a graph as part of your answer but the graph need not be drawn to scale providing that it demonstrates the main features of the approach that you would use.
Step by Step Answer:

This question has not been answered yet.
You can Ask your question!