

Connect the graphs to the situation described. The vertical axes of the graphs represent total costs incurred,
Question:
Connect the graphs to the situation described. The vertical axes of the graphs represent total costs incurred, and the horizontal axes represent levels of cost driver activity during a particular period.
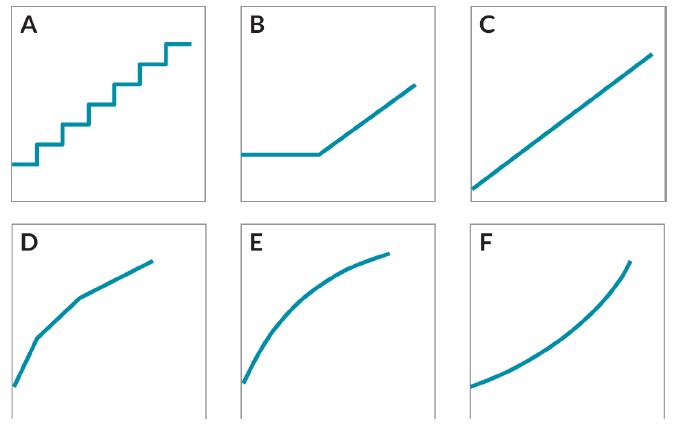
1. Fuel consumption of the company fleet.
2. Monthly bill for maintenance work consisting of a fixed component, plus variable costs that are charged on a per hour basis.
3. Cost of steel, where quantity discounts are granted on every further unit as an additional quantity of 1,000 tons is ordered.
4. Cost of an insurance contract that increases for every 100 employees hired.
5. Cost of a raw material that increases with the quantity ordered.
6. Production costs that tend to decrease as manufacturing efficiency increases.
Step by Step Answer:


Management And Cost Accounting Tools And Concepts In A Central European Context
ISBN: 9783527508228
1st Edition
Authors: Andreas Taschner, Michel Charifzadeh
