The Group of Seven (G7) consists of many of the major world economic powers. It meets annually
Question:
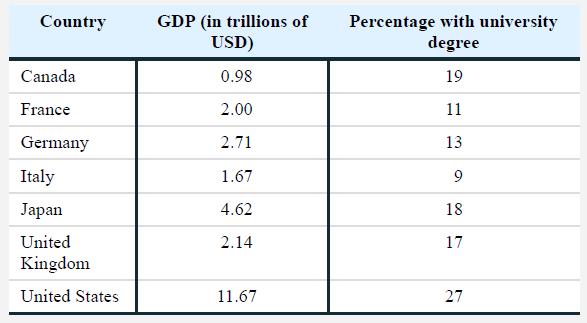
The Group of Seven (G7) consists of many of the major world economic powers. It meets annually to discuss pressing world problems. Here are one year’s data for gross domestic product (GDP) and a measure of education. The measure of education is the percentage of the population between the ages of 25 and 64 that had at least one university degree (Sherman, Honegger, & McGivern, 2003).
a. Create a scatterplot of these data, with university degree percentages on the x-axis. Be sure to label everything and to give it a title. Later, we’ll use statistical tools to determine the equation for the line of best fit. For now, draw a line of best fit that represents your best guess as to where it would go.

b. In your own words, describe the relation between the variables that you see in the scatterplot.
c. Education is on the x-axis, indicating that education is the independent variable. Explain why it is possible that education predicts GDP. Now reverse your explanation of the direction of prediction, explaining why it is possible that GDP predicts education.
Step by Step Answer:

Statistics For The Behavioral Sciences
ISBN: 9781319190743
5th Edition
Authors: Susan A. Nolan, Thomas Heinzen


