With data from the U.S. Energy Information Administration, the following figure shows a scatter plot of tons
Question:
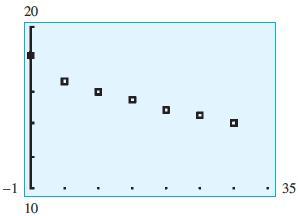
With data from the U.S. Energy Information Administration, the following figure shows a scatter plot of tons of carbon dioxide (CO2) emissions per person for selected years from 2010 and projected to 2040, with x as the number of years past 2010.
(a) Which of the following functions would be an appropriate model: growth exponential, decay exponential, logarithmic, or logistic?
(b) The point (20, 14.8) is one of the data points plotted; interpret this point in terms of the application.

Fantastic news! We've Found the answer you've been seeking!
Step by Step Answer:
Related Book For 

Mathematical Applications For The Management, Life And Social Sciences
ISBN: 9781337625340
12th Edition
Authors: Ronald J. Harshbarger, James J. Reynolds
Question Posted:


