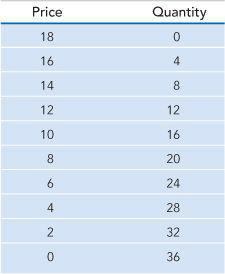
1.5. The following table shows the demand curve facing a monopolist who produces at a constant marginal...
Question:
1.5. The following table shows the demand curve facing a monopolist who produces at a constant marginal cost of $10:

a. Calculate the firm’s marginal revenue curve.
b. What are the firm’s profit-maximizing output and price? What is its profit?
c. What would the equilibrium price and quantity be in a competitive industry?
d. What would the social gain be if this monopolist were forced to produce and price at the competitive equilibrium? Who would gain and lose as a result?
Fantastic news! We've Found the answer you've been seeking!
Step by Step Answer:
Related Book For 

Question Posted:


