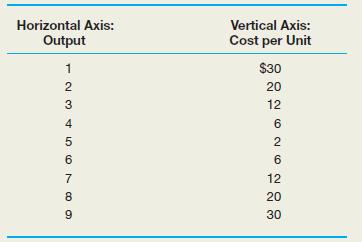
2. Graph the following costs per unit, and answer the questions that follow. a. Is the relationship...
Question:
2. Graph the following costs per unit, and answer the questions that follow.

a. Is the relationship between cost per unit and output linear or nonlinear? Why?
b. In what range in output is the relationship inverse?
In what range in output is the relationship direct?
c. In what range in output is the slope negative?
In what range in output is the slope positive?
d. What is the slope between 1 and 2 units?
Step by Step Answer:
Related Book For 

Question Posted:


