

*2. The graph below depicts the market for aloe vera gel. The left-hand panel depicts market demand...
Question:
*2. The graph below depicts the market for aloe vera gel. The left-hand panel depicts market demand and industry supply; the right-hand panel depicts the long-run cost curves for a representative firm in the industry.
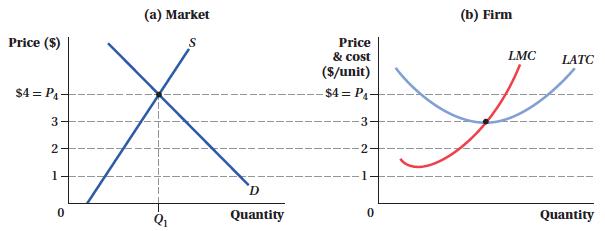
a. Are the firms in the industry earning economic profits or losses? How can you tell?
b. The condition you indicated in
(a) will result in entry or exit from the aloe vera gel industry. Indicate whether we will see entry or exit, and depict the effects of that movement in the diagram for the industry.
c. As a result of this change in the market, the price will change. Depict the effects of the price change on the representative firm in the right-hand panel.
d. At what price will entry/exit stop? Briefly explain why.
Step by Step Answer:


Microeconomics
ISBN: 9780716759751
1st Edition
Authors: Austan Goolsbee, Steven Levitt, Chad Syverson
