In this chapter the empirical illustration used the PSID control group and the NSW treatment group. Dehejia
Question:
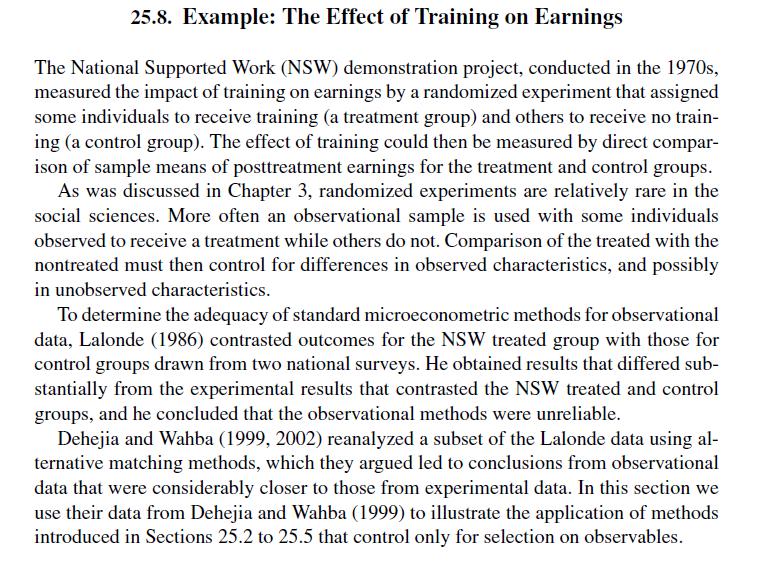
In this chapter the empirical illustration used the PSID control group and the NSW treatment group. Dehejia and Wahba (2002) used two control groups. There is another control group available based on the CPS. In this exercise you will be asked to replicate some of the calculations reported here using the CPS control group in place of the PSID sample.
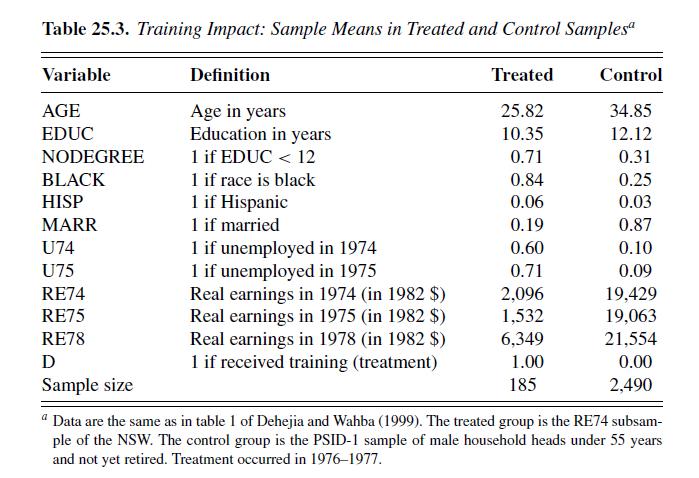
(a) Generate a table similar to Table 25.3. Compare the NSW group with the CPS controls in terms of age, ethnic composition, educational attainment, and pretreatment earnings.
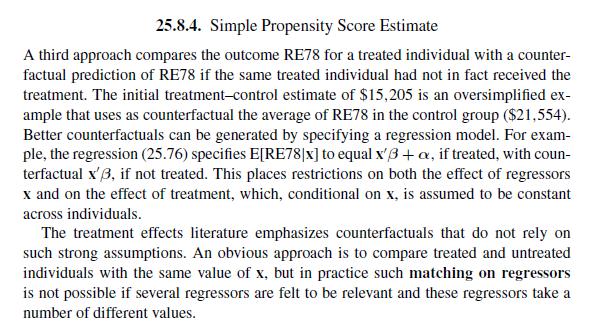
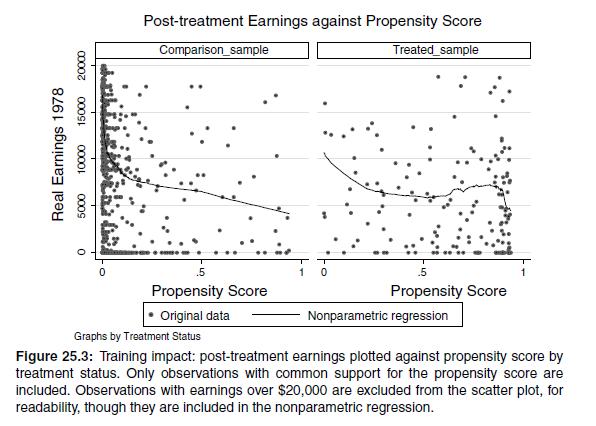
(b) The differences between the treatment and control groups can be viewed using the estimated propensity score, as was done in Section 25.8. Using the approach of Section 25.8.4 estimate the propensity score for the NSW-CPS composite sample, incorporating the covariates linearly and with higher order terms, as in Dehejia and Wahba (2002). Ignoring those comparison units whose propensity scores are less than the minimum of the treated units, compare the two sets of propensity scores using a histogram. Comment on the goodness of match with comparison units in different propensity score intervals ( \(b\) bins").
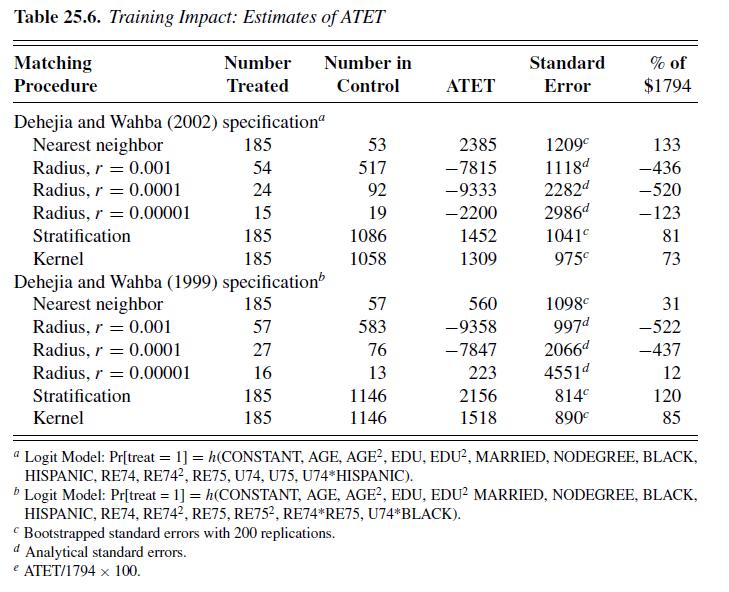
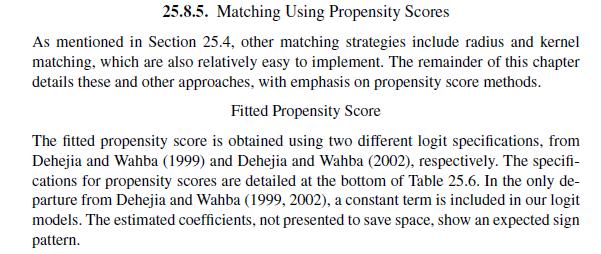
(c) Using the matching methods described and implemented in Sections 25.8.4 and 25.8 .5 (especially nearest-neighbor, stratification, or interval matching, kernel matching, and radius matching), construct a table similar to Table 25.6. Comment on the estimates of ATET and compare them with those based on the PSID comparison group.
Step by Step Answer:

Microeconometrics Methods And Applications
ISBN: 9780521848053
1st Edition
Authors: A.Colin Cameron, Pravin K. Trivedi


