1.5. The marginal cost, marginal social cost, and demand for fish are represented by the curves in...
Question:
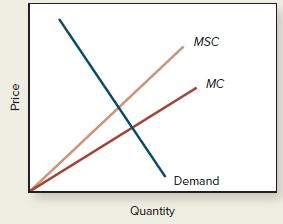
1.5. The marginal cost, marginal social cost, and demand for fish are represented by the curves in the graph below. Suppose that there are no restrictions on fishing. (LO8-1)
a. Assuming perfect competition, demonstrate graphically what the catch is going to be, and at what price it will be sold.
b. What are the socially efficient price and output?

Fantastic news! We've Found the answer you've been seeking!
Step by Step Answer:
Related Book For 

Question Posted:


