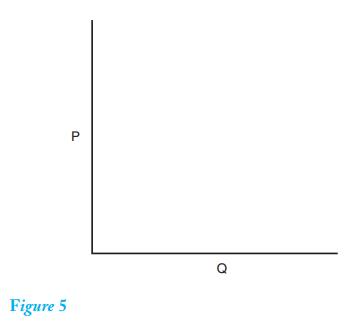
Draw a supply curve, S 1 , in Figure 5, and a second supply curve, S 2
Question:
Draw a supply curve, S1 , in Figure 5, and a second supply curve, S2 , that represents an increase in supply.

Transcribed Image Text:
Figure 5 P Q
Step by Step Answer:

This question has not been answered yet.
You can Ask your question!
Related Book For 

Question Posted:
Students also viewed these Business questions
-
QUIZ... Let D be a poset and let f : D D be a monotone function. (i) Give the definition of the least pre-fixed point, fix (f), of f. Show that fix (f) is a fixed point of f. [5 marks] (ii) Show that...
-
Consider the following context-free grammar of expressions E ::= n | (E, E) where n ranges over integers. (a) Present a right-most derivation of the expression ((21, 18), 17). [2 marks] (b) List the...
-
Consider the following table, which gives the running time T(n) in seconds for a program for various values of the input size n: a. What is the value of T(n) if n = 160007 10240 5120 40960 20480 B C...
-
Refer to the information for Dunn Products Inc. in Problem 11-53B. Data from exercise 11-53B, Dunn Products Inc. Income Statement For the year ended December 31, 2019 The following balance sheet...
-
What is the difference between a causal model and a time-series model?
-
A government agency states that the mean annual salary of civilian federal employees is the same in California and Illinois. The mean annual salary for 180 civilian federal employees in California is...
-
Top Sail Realty is one of the largest time-sharing and rental brokers for vacation cottages along the North Carolina coast. After 10 successful years of matching up owners and renters, Top Sail...
-
Quad Enterprises is considering a new three-year expansion project that requires an initial fixed asset investment of $2.33 million. The fixed asset will be depreciated straight-line to zero over its...
-
A major technological improvement leads to a large decrease in the cost of production. Using Figure 6 draw a new supply curve, S 2 , to reflect this change. Then state the new equilibrium price and...
-
Draw a demand curve, D 1 , in Figure 4. Then draw a second demand curve, D 2 , that illustrates a decrease in demand. Figure 4 P Q
-
Determine whether the following series converge. In k -1) k k=2
-
3. Different positions of Vermiform appendix.
-
Define Image?
-
What is Dynamic Range?
-
Define Brightness?
-
What is Chromatic Adoption?
-
There is some concern that if a woman has an epidural to reduce pain during childbirth, the drug can get into the baby's bloodstream, making the baby sleepier and less willing to breastfeed. In...
-
A Alkynes can be made by dehydrohalogenation of vinylic halides in a reaction that is essentially an E2 process. In studying the stereochemistry of this elimination, it was found that...
-
User cost is equal to the present value of future profits in the model presented in Figure. Choosing the optimal extraction level Will the optimal quantity to mine in the present year increase or...
-
Various cultures have come up with their own methods to limit catch size and prevent fishery collapse. In old Hawaii, certain fishing grounds near shore could be used only by certain individuals. And...
-
On the basis of the three individual demand schedules below, and assuming these three people are the only ones in the society, determine (a) The market demand schedule on the assumption that the good...
-
A proposed $2.5 M investment in new equipment at a 100 MG/y M&Ms factory will save the plant $800,000/y in energy costs. Assuming an annual interest rate of 5%/y (compounded annually), and an...
-
Brief Exercise 10-7 Coronado Company obtained land by issuing 2,250 shares of its $14 par value common stock. The land was recently appraised at $103,240. The common stock is actively traded at $44...
-
The following schedule reconciles Cele Co.'s pretax GAAP income Pretax GAAP income Nondeductible expense for fines Tax deductible depreciation in excess of GAAP depreciation expens Taxable rental...

Study smarter with the SolutionInn App


