

Question: The Problem 2 worksheet contains the daily sales volume (in dollars) of laser printers, printer cartridges, and school supplies. Find and interpret the correlations between
The Problem 2 worksheet contains the daily sales volume (in dollars) of laser printers, printer cartridges, and school supplies. Find and interpret the correlations between each pair of these quantities.
Run a descriptive statistics on the stocks column of the Returns worksheet. Next to each returned value write a one-sentence definition, in your own words, of what that number tells you.
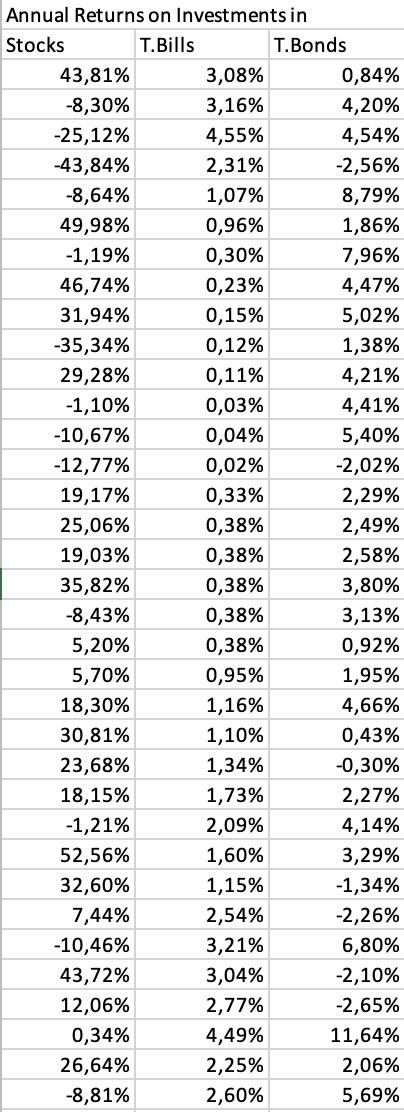
Annual Returns on Investments in Stocks T.Bills 43,81% -8,30% -25,12% -43,84% -8,64% 49,98% -1,19% 46,74% 31,94% -35,34% 29,28% -1,10% -10,67% -12,77% 19,17% 25,06% 19,03% 35,82% -8,43% 5,20% 5,70% 18,30% 30,81% 23,68% 18,15% -1,21% 52,56% 32,60% 7,44% -10,46% 43,72% 12,06% 0,34% 26,64% -8,81% 3,08% 3,16% 4,55% 2,31% 1,07% 0,96% 0,30% 0,23% 0,15% 0,12% 0,11% 0,03% 0,04% 0,02% 0,33% 0,38% 0,38% 0,38% 0,38% 0,38% 0,95% 1,16% 1,10% 1,34% 1,73% 2,09% 1,60% 1,15% 2,54% 3,21% 3,04% 2,77% 4,49% 2,25% 2,60% T.Bonds 0,84% 4,20% 4,54% -2,56% 8,79% 1,86% 7,96% 4,47% 5,02% 1,38% 4,21% 4,41% 5,40% -2,02% 2,29% 2,49% 2,58% 3,80% 3,13% 0,92% 1,95% 4,66% 0,43% -0,30% 2,27% 4,14% 3,29% -1,34% -2,26% 6,80% -2,10% -2,65% 11,64% 2,06% 5,69%
Step by Step Solution
3.43 Rating (169 Votes )
There are 3 Steps involved in it
To solve this problem you need to complete two tasks finding correlations between sales quantities and performing descriptive statistics on stock retu... View full answer

Get step-by-step solutions from verified subject matter experts