

Question: A model of an automobile driver attempting to steer a course is shown in Figure P9.18, where K = 6.0. (a) Find the frequency response
A model of an automobile driver attempting to steer a course is shown in Figure P9.18, where K = 6.0.
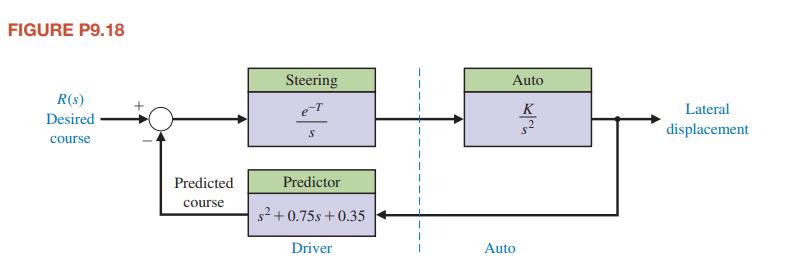
(a) Find the frequency response and the gain and phase margins when the reaction time T = 0.
(b) Find the phase margin when the reaction time is T = 0.15 s.
(c) Find the reaction time that will cause the system to be borderline stable (P M. . = 0°).
FIGURE P9.18 R(S) Desired course Predicted course Steering S Predictor s+0.75s +0.35 Driver Auto K s Auto Lateral displacement
Step by Step Solution
3.45 Rating (165 Votes )
There are 3 Steps involved in it
The transfer function is The Bode plot is shown in Figure P918 The following ... View full answer

Get step-by-step solutions from verified subject matter experts