

Question: P8.22 The frequency response of a process G j ( ) is shown in Figure P8.22. Determine G s ( ). Magnitude (dB) 10
P8.22 The frequency response of a process G j ( ) ω is shown in Figure P8.22. Determine G s( ). 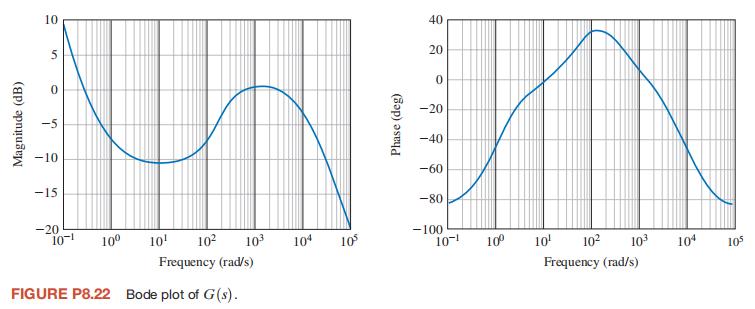
Magnitude (dB) 10 5 0 40 20 0 -5 -10 -15 -20 Phase (deg) -20 -40 -60 -80 10-1 100 10 102 103 -100 104 105 10-1 10 10 Frequency (rad/s) FIGURE P8.22 Bode plot of G(s). 102 103 104 105 Frequency (rad/s)
Step by Step Solution
There are 3 Steps involved in it
1 Expert Approved Answer
Step: 1 Unlock

Question Has Been Solved by an Expert!
Get step-by-step solutions from verified subject matter experts
Step: 2 Unlock
Step: 3 Unlock