An article in the Journal of Environmental Engineering (Vol. 115, No. 3, 1989, pp. 608619) reported the
Question:
An article in the Journal of Environmental Engineering
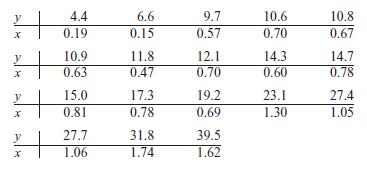
(Vol. 115, No. 3, 1989, pp. 608–619) reported the results of a study on the occurrence of sodium and chloride in surface streams in central Rhode Island. The data shown are chloride concentration y (in mg/1) and roadway area in the watershed x (in %).

(a) Draw a scatter diagram of the data. Does a simple linear regression model seem appropriate here?
(b) Fit the simple linear regression model using the method of least squares.
(c) Estimate the mean chloride concentration for a watershed that has 1% roadway area.
(d) Find the fitted value corresponding to x 0.47 and the associated residual.
(e) Suppose we wish to fit a regression model for which the true regression line passes through the point (0, 0). The appropriate model is Y x . Assume that we have n pairs of data (x1, y1), (x2, y2), . . . , (xn, yn). Show that the least squares estimate of is
(f) Use the results of part
(e) to fit the model Y x to the chloride concentration–roadway area data in this exercise.
Plot the fitted model on a scatter diagram of the data and comment on the appropriateness of the model.
Step by Step Answer:

Engineering Statistics
ISBN: 9780471388791
2nd Edition
Authors: Douglas C. Montgomery, George C. Runger, Norma F. Hubele


