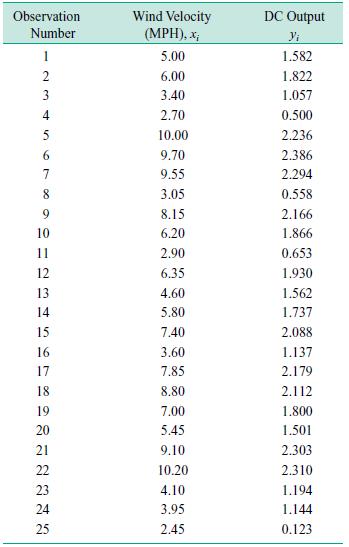
The data that follow are DC output from a windmill (y) and wind velocity (x). (a) Draw
Question:
The data that follow are DC output from a windmill (y)
and wind velocity (x).
(a) Draw a scatter diagram of these data. What type of relationship seems appropriate in relating y to x?
(b) Fit a simple linear regression model to these data.
(c) Test for significance of regression using 0.05. What conclusions can you draw?
(d) Plot the residuals from the simple linear regression model versus and versus wind velocity x. What do you conclude about model adequacy?
(e) Based on the analysis, propose another model relating y to x.
Justify why this model seems reasonable.
(f) Fit the regression model you have proposed in part (e).
Test for significance of regression (use 0.05), and graphically analyze the residuals from this model. What can you conclude about model adequacy?

Step by Step Answer:

Engineering Statistics
ISBN: 9780471388791
2nd Edition
Authors: Douglas C. Montgomery, George C. Runger, Norma F. Hubele


