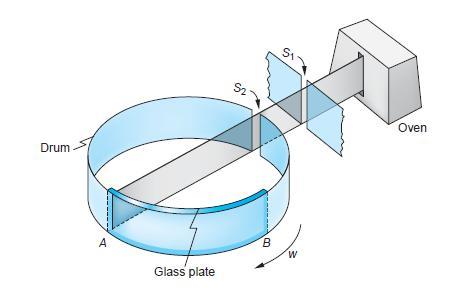
Question: An early method testing Maxwells theoretical prediction for the distribution of molecular speeds is shown in Figure 8-34. In 1925 Otto Stern used a beam
An early method testing Maxwell’s theoretical prediction for the distribution of molecular speeds is shown in Figure 8-34. In 1925 Otto Stern used a beam of Bi2 molecules emitted from an oven at 850 K. The beam defined by slit S1 was admitted into the interior of a rotating drum via slit S2 in the drum wall. The identical bunches of molecules thus formed struck and adhered to a curved glass plate fixed to the interior drum wall, the fastest molecules striking near A, which was opposite S2, the slowest near B, and the others in between depending on their speeds. The density of the molecular deposits along the glass plate was measured with a densitometer. The density (proportional to the number of molecules) plotted against distance along the glass plate (dependent on v) made possible determination of the speed distribution. If the drum is 10 cm in diameter and is rotating at 6250 rpm,

(a) Find the distance from A where molecules traveling at vm, (v), and vrms will strike.
(b) The plot in (a) must be corrected slightly in order to be compared with Maxwell’s distribution equation. Why?
(c) Would N2 molecules work as well as Bi2 molecules in this experiment? Why or why not?
Drum A Glass plate S2 B W Oven
Step by Step Solution
3.48 Rating (155 Votes )
There are 3 Steps involved in it
a At T 850K The times for molecules with each of these speeds to travel across the 10cm diameter of ... View full answer

Get step-by-step solutions from verified subject matter experts


