In the United States, the governments data on real growth improve over time. For instance, we now
Question:
In the United States, the government’s data on real growth improve over time. For instance, we now know that in the early 1970s, the economy was actually growing 4% faster than people believed. At the time, the Fed thought the economy was in a deep recession, so it mistakenly boosted money growth. The Fed’s overreaction caused inflation. Real-time surveys in the early 1970s depicted an awful economy, but as economic historians have gone back to the data, they have discovered that the economy wasn’t as awful as they thought: Someone just put the thermometer in the fridge.
Economists at the Philadelphia Federal Reserve have collected data on how our view of the economy has changed over time. This
“real-time data” is summarized by Croushore and Stark in a review article entitled “A Funny Thing Happened On the Way to the Data Bank: A Real-Time Data Set for Macroeconomists (Federal Reserve Bank of Philadelphia, Business Review, Sept./Oct. 2000, 15–27).” Let’s use their summary of the data and a six-sided die to see just how inaccurate our real-time views of the economy actually are.
a. We’re going to reenact the 1970s, and we’ll start figuring out how error-filled the government’s growth estimates will be. Croushore and Stark report that, on average:
i. One-sixth of the time, measured growth is 2% better than actual growth.
ii. One-third of the time, measured growth is 1% better than actual growth.
iii. One-third of the time, measured growth is 1.5% worse than actual growth.
iv. One-sixth of the time, measured growth is 3% worse than actual growth.
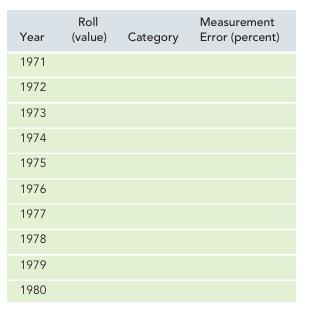
Find a six-sided die (or use Excel to simulate same) and record your rolls below. If you’ve rolled a 1, count that in category i; if you roll a 2 or 3, place that in category ii; a 4 or 5 goes in category iii; and if you roll a 6, place that in category iv. Then write down how much measurement error you’ll have for that year.
Example: If your first roll was a 4, that places you in category iii, so write down “–1.5%” as the amount of measurement error for 1971.
(Note: Psychologists and behavioral economists have found that people are fairly bad at generating truly random numbers on their own, so it’s best to just roll the die.) pg65
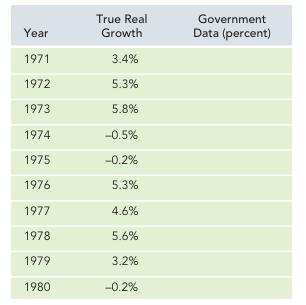
b. Let’s see what values we get when we add together the true real growth rate (which economists will only know years later) with the measurement error in the previous table.
For “true real growth,” we use the most recent data in the table below—but of course even these estimates could change in the future. The sum is the actual government data that will wind up in the Federal Reserve chair’s hands.
Example: If your first roll was a 4, that placed you in category iii, so subtract 1.5% from the true 1971 growth rate to yield a real-time government report of 1.9% annual growth.
c. In your simulation, how many times was the government data off by 2% or more?
d. If the Solow growth rate in the 1970s was actually 3.6% (the average growth rate in the 1970s), then in how many years did your government data give values below 3.6%
when true real growth was above 3.6%? How often did the reverse occur, with your government data above the Solow rate while true real growth was below?
e. Add together your two values from part d.
This is the number of times that even a very good central banker would have wanted to push AD in the wrong direction: it’s the number of times this weather vane was pointing in entirely the wrong direction.
(Note: You might be wondering whether the U.S. government tends to exaggerate extragood economic news just before an election. As far as economists can tell, the answer is no, at least when it comes to the official GDP number.
U.S. GDP estimates contain mistakes before an election just as often as usual, but those mistakes don’t tend to favor the political party in power.
In Japan, though, GDP reports do tend to be extra-optimistic just before an election. For more, see Faust, Rogers, and Wright, “News and Noise in G-7 GDP Announcements,”
online at the Federal Reserve Board’s Web site.)
Step by Step Answer: