

Suppose that the supply curve for solar panels is as shown in the diagram: pg85 The government
Question:
Suppose that the supply curve for solar panels is as shown in the diagram: pg85
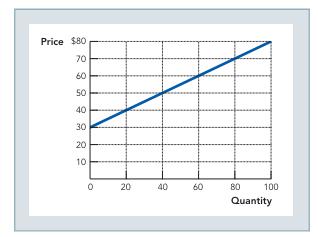
The government decides that it would like to increase the quantity of solar panels in use, so it offers a $20 subsidy per panel to producers. Draw the new supply curve. As a hint, remember our analysis of how a tax affects supply, as shown in Figure 3.12, and bear in mind that a subsidy can be thought of as a “negative tax.”
Step by Step Answer:

This question has not been answered yet.
You can Ask your question!
Related Book For 

Question Posted:
