2. The following table shows the number of physical examinations given by doctors at an HMO with...
Question:
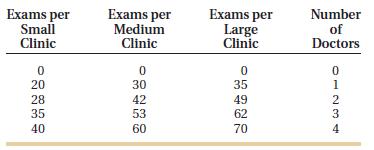
2. The following table shows the number of physical examinations given by doctors at an HMO with three different-size clinics: small, medium, and large. The larger the clinic, the more patients the doctors can handle.

a. Show the relationship between doctors and physical exams given with three curves, where the number of doctors is on the horizontal axis and the number of examinations is on the vertical axis.
b. Describe how the three relationships compare with one another.
c. Is a change in the number of doctors a shift of or a movement along the curve?
d. Is a change in the size of the clinic a shift of or a movement along the curve?
Fantastic news! We've Found the answer you've been seeking!
Step by Step Answer:
Related Book For 

Principles Of Microeconomics
ISBN: 9784492370292
6th Edition
Authors: John B. Taylor, Akila Weerapana
Question Posted:


