In eukaryotes, the three RNA polymerases, Pol I, II, and III, each transcribes unique genes required for
Question:
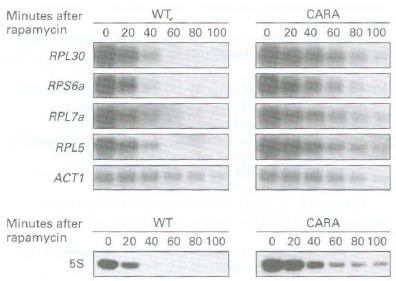
a. To analyze rRNA transcription by Pol I, total RNA was isolated from rapidly growing wild type (WT) and CARA cells at various times following the addition of rapamycin. The concentration of the 355 rRNA precursor transcribed by Pol I (sec Figure 8-38) was assayed by the primer-extension method. Since the 5' end of the 35S rRNA precursor is degraded during the processing of 255 and 18S rRNA, this method measures the relatively short-lived pre-rRNA precursor. This is an indirect measure of the rate of rRNA transcription by Pol I. The results of this primer extension assay are shown below. How does the CARA Pol I-Rrn3 fusion affect the response of Poll transcription to rapamycin?

b. The concentrations of four mRNAs encoding ribosomal proteins, RPL30, RPS6a, RPL7a, and RPL5, and the mRNA for actin (ACTl ), a protein present in the cytoskeleton, were assessed in wild-type and CARA cells by Northern blotting at various times after addition of rapamycin to rapidly growing cells (upper auto radiograms). 5S rRNA transcription was assayed by pulse labeling rapidly growing WT

and CARA cells with 1H uracil (for 20 minutes) at various rimes after addition of rapamycin to the media. Total cellular RNA was isolated and subjected to gel electrophoresis and autoradiography. The lower autoradiogram shows the region of the gel containing 5S rRNA. Based on these data, what can be concluded about the influence of Pol I transcription on the transcription of ribosomal protein genes by Pol II and 5S rRNA by Pol Ill?
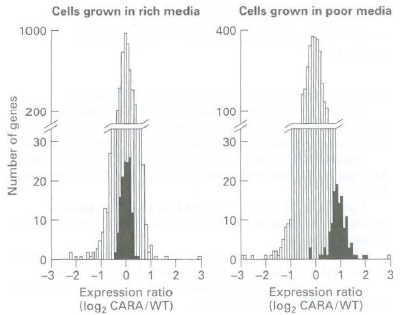
c. To determine whether the difference in behavior of wild-type and CARA cells can be observed under normal physiological conditions (i.e., without drug treatment), cells were subjected to a shift in their food source, from nutrientrich media to nutnent-poor media. Under these condition<>, in wild-type cells, the TOR protein kinase becomes inactive. Consequently, shifting cells from nutrient-rich media to nutrient poor media should result in a normal physiological response that is equivalent to treating cells with rapamycm, which inhibits TOR. To determine how the CARA fusion protein affected the response to this media shift, RNA was extracted from wild-type and CARA cells and used to probe microarrays containing all yeast open reading frames. The extent of RNA hybridization with the arrays was quantified and is expressed in the graphs as log2 of the ratio of CARA cell RNA concentration to wild-type-cell RNA concentration for each open reading frame. A value of zero indicates that the two strains of yeast exhibit the same level of expression for those specific RNAs. A value of 1 indicates that the CARA cells contain twice as much of that particular RNA as do wild-type cells. The graphs below show the number of open reading frames (y axis) that have values for log2 of this ratio, indicated by the x axis. The results of hybndization to open reading frames encoding mRNAs for ribosomal proreins are shown by black bars, those for all other mRNAs by white bars. The graph on the left gives results for cells grown in nutrient-rich medium, the graph on the right for cells shifted to nutrient-poor medium for 90 minutes. What do these data suggest about the regulation of ribosomal protein gene transcription by Pol II?

Step by Step Answer:

Molecular Cell Biology
ISBN: 978-1429234139
7th edition
Authors: Harvey Lodish, Arnold Berk, Chris A. Kaiser, Monty Krieger, Anthony Bretscher, Hidde Ploegh, Angelika Amon, Matthew P. Scott


