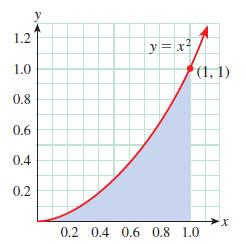
Approximate the area under the curve in Figure 18.7 using (A_{1}). Figure 18. 7 1.2 1.0
Question:
Approximate the area under the curve in Figure 18.7 using \(A_{1}\).
Figure 18.7

Transcribed Image Text:
1.2 1.0 0.8 0.6 0.4 0.2 y y=x (1, 1) 0.2 0.4 0.6 0.8 1.0 x
Fantastic news! We've Found the answer you've been seeking!
Step by Step Answer:
Answer rating: 100% (QA)
To approximate the area under the curve y x2 from x 0 to x 1 using A1 were going to use the left Rie...View the full answer

Answered By

Aqib Parvej
I am teaching since my graduation time so I have teaching experience of about 5 years and in these years I learn to teach in the best and interesting way .
4.80+
20+ Reviews
41+ Question Solved
Related Book For 

Question Posted:
Students also viewed these Sciences questions
-
Refer to the graph in Fig. 11. Draw the rectangles that approximate the area under the curve from 0 to 8 when using the midpoint rule with n = 4. Y 50 40 30 20 10 0 1 2 3 4 5 6 7 8 Figure 11
-
A preferred stock has which of these characteristics? Multiple choice question. Residual ownership claim Zero dividend growth Owned primarily by individual investors Guaranteed voting rights
-
The market for electricity is a naturally monopolistic market. The graph below depicts the monthly demand and marginal revenue curves for this market and the marginal cost and average total cost...
-
1-Is it a good business strategy to have a day care center, Harley Davidson Motorcycle Dealership Sales and repair, Namaste Yoga studio, bookstore, temporary worker (day laborer) center, state prison...
-
What is the major requirement for a glacier to form?
-
LO5 Explain how the tax benefit rule may apply to bad debt deductions.
-
E 20-9 Preparation of fund balance sheet A general ledger trial balance at June 30, 2013, for Millar City is as follows: Debits Credits Cash $12,000 Taxes receivable 30,000 Allowance for...
-
Using the following financial statements for Pamplin, Inc: a. Compute the following ratios for both 2012 and 2013 using the financial statements that follow. Industry Norm Current ratio...
-
(5 thousands) Sales Cost of goods sold Gross profit Operating expenses Net income Comparative Income Statements For Years Ended December 31, 2017-2011 2017 2016 2015 2014 2013 2012 $2,316 $2,028...
-
First, sketch the region under the graph on the interval \([a, b]\) in Problems 53-55. Then approximate the area of each region for the given value of \(n\). Use the right endpoint of each rectangle...
-
Graph each sequence in Problems 35-42 in two dimensions. \(a_{n}=\frac{n+1}{n^{2}}\)
-
A police car is traveling east at 40.0 m/s along a straight road, overtaking a car ahead of it moving east at 30.0 m/s. The police car has a malfunctioning siren that is stuck at 1 000 Hz. (a) Sketch...
-
The requirement for extended disclosures for oil and gas reserves described in Chapter 2 followed a Congressional hearing on the poor disclosures that Shell Oil had for its reserves. A.Explain three...
-
Question 9 Big Data techniques implemented in the financial sector include: fraud detection O marketing email campaign O customer relationship management techniques O inventory analysis
-
Problem 8-19A Attaining notfonpmt entity variances The Redmond Management Association held its annual public relations luncheon in April Year 2. Based on the previous year's results, the organization...
-
Kay, who is not a real estate dealer, sold an apartment house to Polly during the current year (2020). The closing statement for the sale is as follows. Total selling price $190,000 Add: Polly's...
-
1 English Writing Requirement Assignment Guidelines Sem 1 2023-24 Subject code AAE1D02 Subject title Introduction to Space Exploration Credit value 3 CAR Teachers Prof. WEN Chih-Yung, Prof. WU Bo,...
-
Consider the following game: a) What is the Nash equilibrium in this game? b) If you were Player 1, how would you play this game? Player 2 Left Right 14-100,3 0.3 Up Playr pown 0. 2
-
Explain how the graph of each function can be obtained from the graph of y = 1/x or y = 1/x 2 . Then graph f and give the (a) Domain (b) Range. Determine the largest open intervals of the domain over...
-
Explain the following. a. Hydroelectric power is a relatively cheap source of electricity. b. Geothermal energy is a non-polluting form of energy. c. A disadvantage of wind power is that it causes...
-
At room temperature and pressure (rtp), which of the substances listed below is: a. A solid element? b. A liquid element? c. A gaseous mixture? d. A solid mixture? e. A liquid compound? f. A solid...
-
The apparatus shown on Figure 11.6, was used to estimate the proportion of oxygen in the atmosphere. A volume of dry air (200 cm 3 ) was passed backwards and forwards over heated copper until no...
-
Docs Auto Body has budgeted the costs of the following repair time and parts activities for 2009: Doc's budgets 6,000 hours of repair time in 2009. A profit margin of $7 per labour hour will be added...
-
QUESTION 28 In a perpetual inventory system, the cost of inventory sold is: Debited to accounts receivable. Debited to cost of goods sold. O Not recorded at the time goods are sold. O Credited to...
-
The following financial statements and additional information are reported. IKIBAN INC. Comparative Balance Sheets June 30, 2019 and 2018 2019 2018 $105,709 69,500 66,800 4,700 246,700 127,eee...

Study smarter with the SolutionInn App


