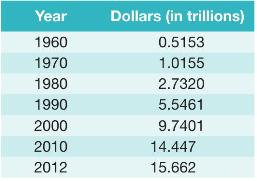
Table 18.5 shows the gross national product (GNP) in trillions of dollars for the years 1960-2012. Find
Question:
Table 18.5 shows the gross national product (GNP) in trillions of dollars for the years 1960-2012. Find the average yearly rate of change of the GNP for the requested years in Problems 19-26.
Table 18.5

1970 to 2000
Transcribed Image Text:
Year 1960 1970 1980 1990 2000 2010 2012 Dollars (in trillions) 0.5153 1.0155 2.7320 5.5461 9.7401 14.447 15.662
Fantastic news! We've Found the answer you've been seeking!
Step by Step Answer:
Answer rating: 100% (1 review)
To find the average yearly rate of change of the gross national product GNP between the years 1970 a...View the full answer

Answered By

Navashree Ghosh
I believe in quality work and customer satisfaction. So, I can assure you that you will get quality work from me when you hire me. Let's work together and build a long-term association.
4.90+
82+ Reviews
116+ Question Solved
Related Book For 

Question Posted:
Students also viewed these Sciences questions
-
Table 18.5 shows the gross national product (GNP) in trillions of dollars for the years 1960-2012. Find the average yearly rate of change of the GNP for the requested years in Problems 19-26. Table...
-
Table 18.5 shows the gross national product (GNP) in trillions of dollars for the years 1960-2012. Find the average yearly rate of change of the GNP for the requested years in Problems 19-26. Table...
-
Table 18.5 shows the gross national product (GNP) in trillions of dollars for the years 1960-2012. Find the average yearly rate of change of the GNP for the requested years in Problems 19-26. Table...
-
How are Recovery Audit Contractors paid? Question 23 options: RACs are reimbursed $100,000 annually RACs are reimbursed on a contingency-based system RACs are paid on a contract basis RACs are not...
-
What generally displaces the blocks on a cliff, forming talus piles?
-
Q4 How is a data model transformed into a database design?
-
Claim: 31.5, s = 4.7, n = 12
-
The Cornchopper Company is considering the purchase of a new harvester. Cornchopper has hired you to determine the break-even purchase price in terms of present value of the harvester. This...
-
IBM stock currently sells for 64 dollars per share. The implied volatility equals 40.0. The risk-free rate of interest is 5.5 percent continuously compounded. What is the delta of a call option with...
-
An object moving in a straight line travels \(d\) miles in \(t\) hours according to the formula \[d(t)=\frac{1}{5} t^{2}+5 t\] What is the object's velocity when \(t=5\) ?
-
In Problems 21-38, guess the requested limits. \(\lim _{n ightarrow \infty} \frac{100}{n}\)
-
Reliable Auto Service was started on January 1, Year 1. The company experienced the following events during its first two years of operation: Events Affecting Year 1 1. Provided $52,000 of repair...
-
The issue of Royal Rose Manufacturing Co., Ltd. with many new employees is the low level of production. Although the company implements training programs for employees, the skill improvement of...
-
For safety reasons an elevator stops with an acceleration of g/3 in the case of an emergency. Let's assume an unusually high ceiling of the elevator to hang three sections lamp one below the other...
-
Can Google be characterized as a monopoly? Justify your answer by specifying and comparing the characteristics of a monopoly with those of Google. What is competition law? How would you justify the...
-
In the case below design and draw a Rich Picture that identifies the key stakeholders, actors, power and decision-making authorities. The novel coronavirus has turned the world upside down as a...
-
1. Two spherical stars A and B have densities PA and PB, respectively. A and B have the same radius, and their masses MA and M are related by MB = 2M. Due to an interaction process, star A loses some...
-
A homogeneous products oligopoly consists of four firms, each of which has a constant marginal cost MC = 5. The market demand curve is given by P = 15 - Q. a) What are the Cournot equilibrium...
-
Write a while loop that uses an explicit iterator to accomplish the same thing as Exercise 7.3. Exercise 7.3. Write a for-each loop that calls the addInterest method on each BankAccount object in a...
-
The diagram below shows the arm of a crane when it is lifting a heavy box. a. By the use of a scale diagram (not calculation) of the forces acting at P, find the weight of the box. b. Another box of...
-
In the circuit below, the 12 V lamp glows when switch s is open. If switch S is then closed, what happens to the brightness of the lamp? A. It stays the same. B. It goes off. C. It becomes dimmer. D....
-
A rock climber climbs up a rock face, as shown in the diagram below. a. To climb the rock face, the climber must do work. Which one of the following forces must the climber work against as he climbs?...
-
you are analyzing the cost of debt for a firm. Do you know that the firms 14 year maturity, 7.8 Percent coupon bonds are selling at a price of $834. The Barnes pay interest semi annually. If these...
-
***Please answer the following using excel and showcasing the formulas/calculations used*** thank you so much Financial information on AAA Ltd. is shown below. AAA Ltd. Income Statement For the Year...
-
2. In an account Anh Paglinawan currently has $216,670.00. At a rate of 8.00% how long will it take for them to have $298,390.00 assuming semi-annually compounding? (Hint: compute the exact years, do...

Study smarter with the SolutionInn App


