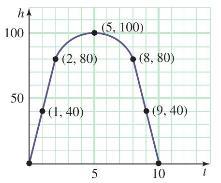
The graph in Figure18.19 shows the height h of a projectile after (t) seconds. In Problems 5-8,
Question:
The graph in Figure18.19 shows the height h of a projectile after \(t\) seconds. In Problems 5-8, find the average rate of change of height (in feet) with respect to the requested changes in time \(t\) (in seconds).
Figure 18.19

1 to \(2\)
Transcribed Image Text:
h4 100 50 (2,80) (1,40) 5 (5, 100) (8,80) (9.40) 10
Fantastic news! We've Found the answer you've been seeking!
Step by Step Answer:
Answer rating: 60% (5 reviews)
To find the average rate of change of the height with respect to time between t ...View the full answer

Answered By

OTIENO OBADO
I have a vast experience in teaching, mentoring and tutoring. I handle student concerns diligently and my academic background is undeniably aesthetic
4.30+
3+ Reviews
10+ Question Solved
Related Book For 

Question Posted:
Students also viewed these Sciences questions
-
Find the centroid of the region shown, not by integration, but by locating the centroids of the rectangles and triangles (from Exercise 39) and using additivity of moments. 2 2 2
-
Use spherical coordinates to find the volume of the following regions. That part of the ball p 4 that lies between the planes z = 2 and z = 23 X 2 z = 23 z = 2
-
Your employer, Reddy & Abel, LLP, Certified Public Accountants (who is registered with the PCAOB and audits public companies), has been approached by a prospective client, Mt. Hood Furniture, Inc.,...
-
AutoSave Off File C30 PivotTable Recommended Table Pivot Tables 2 3 4 5 6 7 8 9 10 11 12 13 14 15 16 17 18 19 20 A Enter Home Insert Tables H Price Par Value B X Coupon Rate Payment Frequency...
-
Who first established the principles of metamorphic facies?
-
Recording the cost of raw materials purchased for use in a process costing system includes a a. Credit to Raw Materials Inventory. b. Debit to Goods in Process Inventory. c. Debit to Factory...
-
What factors might a business take into account when deciding between preference shares and loan capital as a means of raising new finance?
-
During the first month of operations (September 2014), Holt Music Services Corporation completed the following selected transactions: a. The business received cash of $50,000 and a building with a...
-
Cyclone Industrial Corp. has a beta of 1.4. The risk-free rate is 4% and the market risk premium is 5%. What is the cost of equity based on the CAPM? Please answer the question in the unit of...
-
Write out the first five terms (beginning with \(n=1\) ) of the sequences given in Problems 3-10. \(\left\{\frac{3 n+1}{n+2}ight\}\)
-
Consider the sequence \(0.5,0.55,0.555,0.5555, \cdots\). What do you think is the appropriate limit of this sequence?
-
In Figure 3, which of graphs (A), (B), and (C) is not the graph of an antiderivative of y = (x)? Explain. y = f(x) (A) www X (B) (C)
-
Low Desert Pottery works makes a variety of pottery products that it sells to retailers. The company uses a job-order costing system in which departmental predetermined overhead rates are used to...
-
ASSESSMENT CPCCBC5002A Monitor costing systems on medium rise building and construction projects Please provide answer to Part 2 - Monitor expenditure for a medium-rise project as per below...
-
Questions 6-8 refer to the same problem A sinusoidal wave with wavelength 2 m and amplitude 5 mm is traveling along the x axis. The wave is traveling in the -x direction at a speed of 2m/s At t = Os,...
-
Consider a circuit where one or more capacitors is discharged through a light bulb filament with a resistance of 3.0 0.3 . Assume that the resistance of the filament is constant (to within the stated...
-
3. For a vibrating string of length with fixed ends, each mode of vibration can be written as where wk ux(x, t) = M* sin(wxt + k) sin(x) and Mk, Ok are determined by initial conditions. For all k >...
-
Evaluate the following statement: Toyota faces competition from many other firms in the world market for automobiles; therefore, Toyota cannot have market power.
-
Why did management adopt the new plan even though it provides a smaller expected number of exposures than the original plan recommended by the original linear programming model?
-
Stoneflies, Plecoptera spp., lay eggs in freshwater streams and rivers. The eggs hatch into nymphs which live in the water for several years before changing to adults. Stonefly nymphs are known as...
-
Researchers investigated aspects of the anatomy of the Melina tree, Gmelina arborea, which has been introduced into wet and dry forests in Costa Rica. The researchers wanted to know if the diameter...
-
Sharks are an important part of the biodiversity of marine ecosystems. Many species are endangered as a result of overfishing. In 2004, the great white shark, Carcharodon carcharias, was added to...
-
Indicate whether the following managerial policy increases the risk of a death spiral:Use of low operating leverage for productionGroup of answer choicesTrueFalse
-
It is typically inappropriate to include the costs of excess capacity in product prices; instead, it should be written off directly to an expense account.Group of answer choicesTrueFalse
-
Firms can avoid the death spiral by excluding excess capacity from their activity bases. Group of answer choicesTrueFalse

Study smarter with the SolutionInn App


