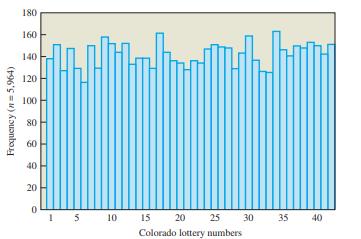
Colorado Lottery Distribution. The histogram in Figure 7 shows the distribution of 5,964 Colorado lottery numbers (possible
Question:
Colorado Lottery Distribution. The histogram in Figure 7 shows the distribution of 5,964 Colorado lottery numbers
(possible values range from 1 to 42).
a. Assuming the lottery drawings are random, what would you expect the probability of any number to be?
b. Based on the histogram, what is the relative frequency probability of the most frequently appearing number?
c. Based on the histogram, what is the relative frequency probability of the least frequently appearing number?
d. Comment on the deviations of the empirical probabilities from the expected probabilities. Would you say these deviations are significant?

Fantastic news! We've Found the answer you've been seeking!
Step by Step Answer:
Related Book For 

Question Posted:


