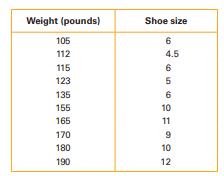
grouped Shoe Data. The following table gives measurements of weight and shoe size for 10 people (including
Question:
grouped Shoe Data. The following table gives measurements of weight and shoe size for 10 people (including both men and women).
a. Construct a scatterplot for the data. Estimate or compute the correlation coefficient. Based on this correlation coefficient, would you conclude that shoe size and weight are correlated? Explain.

b. You later learn that the first five data values in the table are for women and the next five are for men. How does this change your view of the correlation? Is it still reasonable to conclude that shoe size and weight are correlated?
Fantastic news! We've Found the answer you've been seeking!
Step by Step Answer:
Related Book For 

Question Posted:


