old Faithful. The histogram in Figure 9 shows the times between eruptions of Old Faithful geyser in
Question:
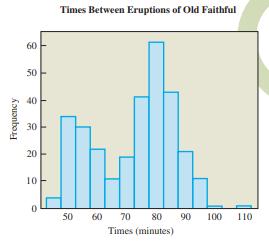
old Faithful. The histogram in Figure 9 shows the times between eruptions of Old Faithful geyser in Yellowstone National Park for a sample of 300 eruptions (with 299 times between eruptions). Over the histogram, draw a smooth curve that captures its general features. Then classify the distribution according to its number of modes and its symmetry or skewness. In words, summarize the meaning of your results.

Fantastic news! We've Found the answer you've been seeking!
Step by Step Answer:
Related Book For 

Question Posted:


