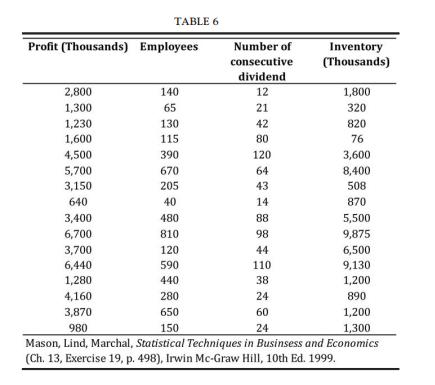
Table 6 shows for a group of companies the relation between their profits and some explanatory variables.
Question:
Table 6 shows for a group of companies the relation between their profits and some explanatory variables.


a. Run a multiple regression with ANOVA table in all three independent variables, and using the global F-test, test simultaneously the hypothesis that all the slope coefficients are jointly equal to zero: H0 : b1 ¼ b2 ¼ b3 ¼ 0:
b. Conduct a test of hypothesis for the individual regression coefficients and then, of these, drop the one which is not appearing statistically significant using the ANOVA table.
c. Run now a new regression and compare the ANOVA table versus the one of point
a. d. As we have seen the assumptions for regression also require that the residuals remain constant for all predicted values Yb of the dependent variable. This condition is called homoscedasticity. A way to check for this is to plot and evaluate the behavior of residuals versus the predicted values. Do this for the second regression in two independent variables and draw conclusion about the homoscedasticity.
Step by Step Answer:

Elements Of Numerical Mathematical Economics With Excel Static And Dynamic Optimization
ISBN: 9780128176498
1st Edition
Authors: Giovanni Romeo


