

Question: Exercise 8.22 introduced a data set on nutrition information on Starbucks food menu items. Based on the scatterplot and the residual plot provided, describe the
Exercise 8.22 introduced a data set on nutrition information on Starbucks food menu items. Based on the scatterplot and the residual plot provided, describe the relationship between the protein content and calories of these menu items, and determine if a simple linear model is appropriate to predict amount of protein from the number of calories.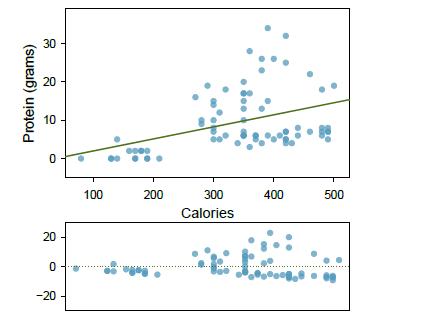
Data from Exercise 8.22
Identify the outliers in the scatterplots shown below and determine what type of outliers they are. Explain your reasoning.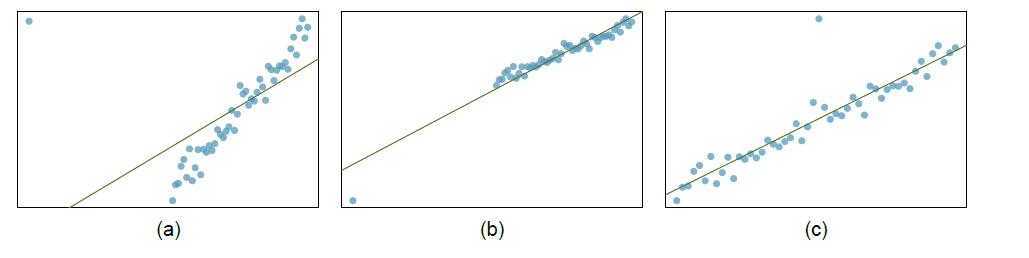
Protein (grams) 30 20 10 0 20 0 -20 100 0000 200 300 Calories 400 500
Step by Step Solution
3.40 Rating (150 Votes )
There are 3 Steps involved in it
The scatterplot on the top of the first image shows that there is a general upward trend in the protein content as the calories increase for the Starb... View full answer

Get step-by-step solutions from verified subject matter experts