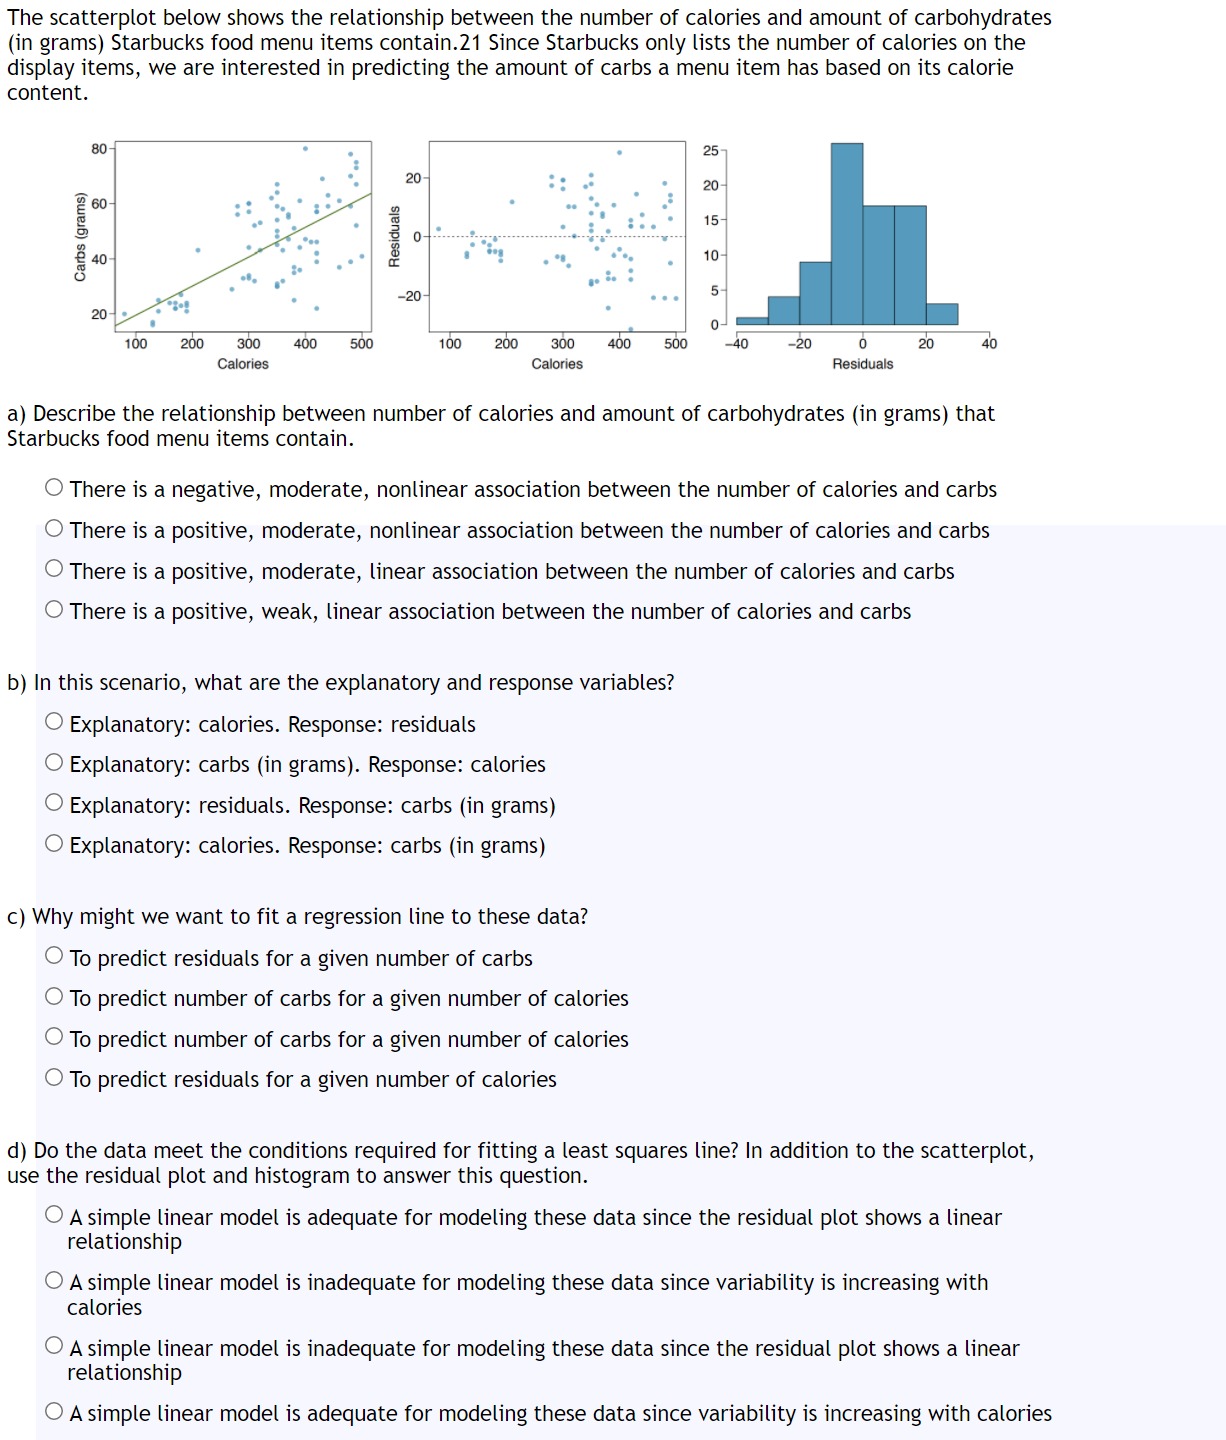
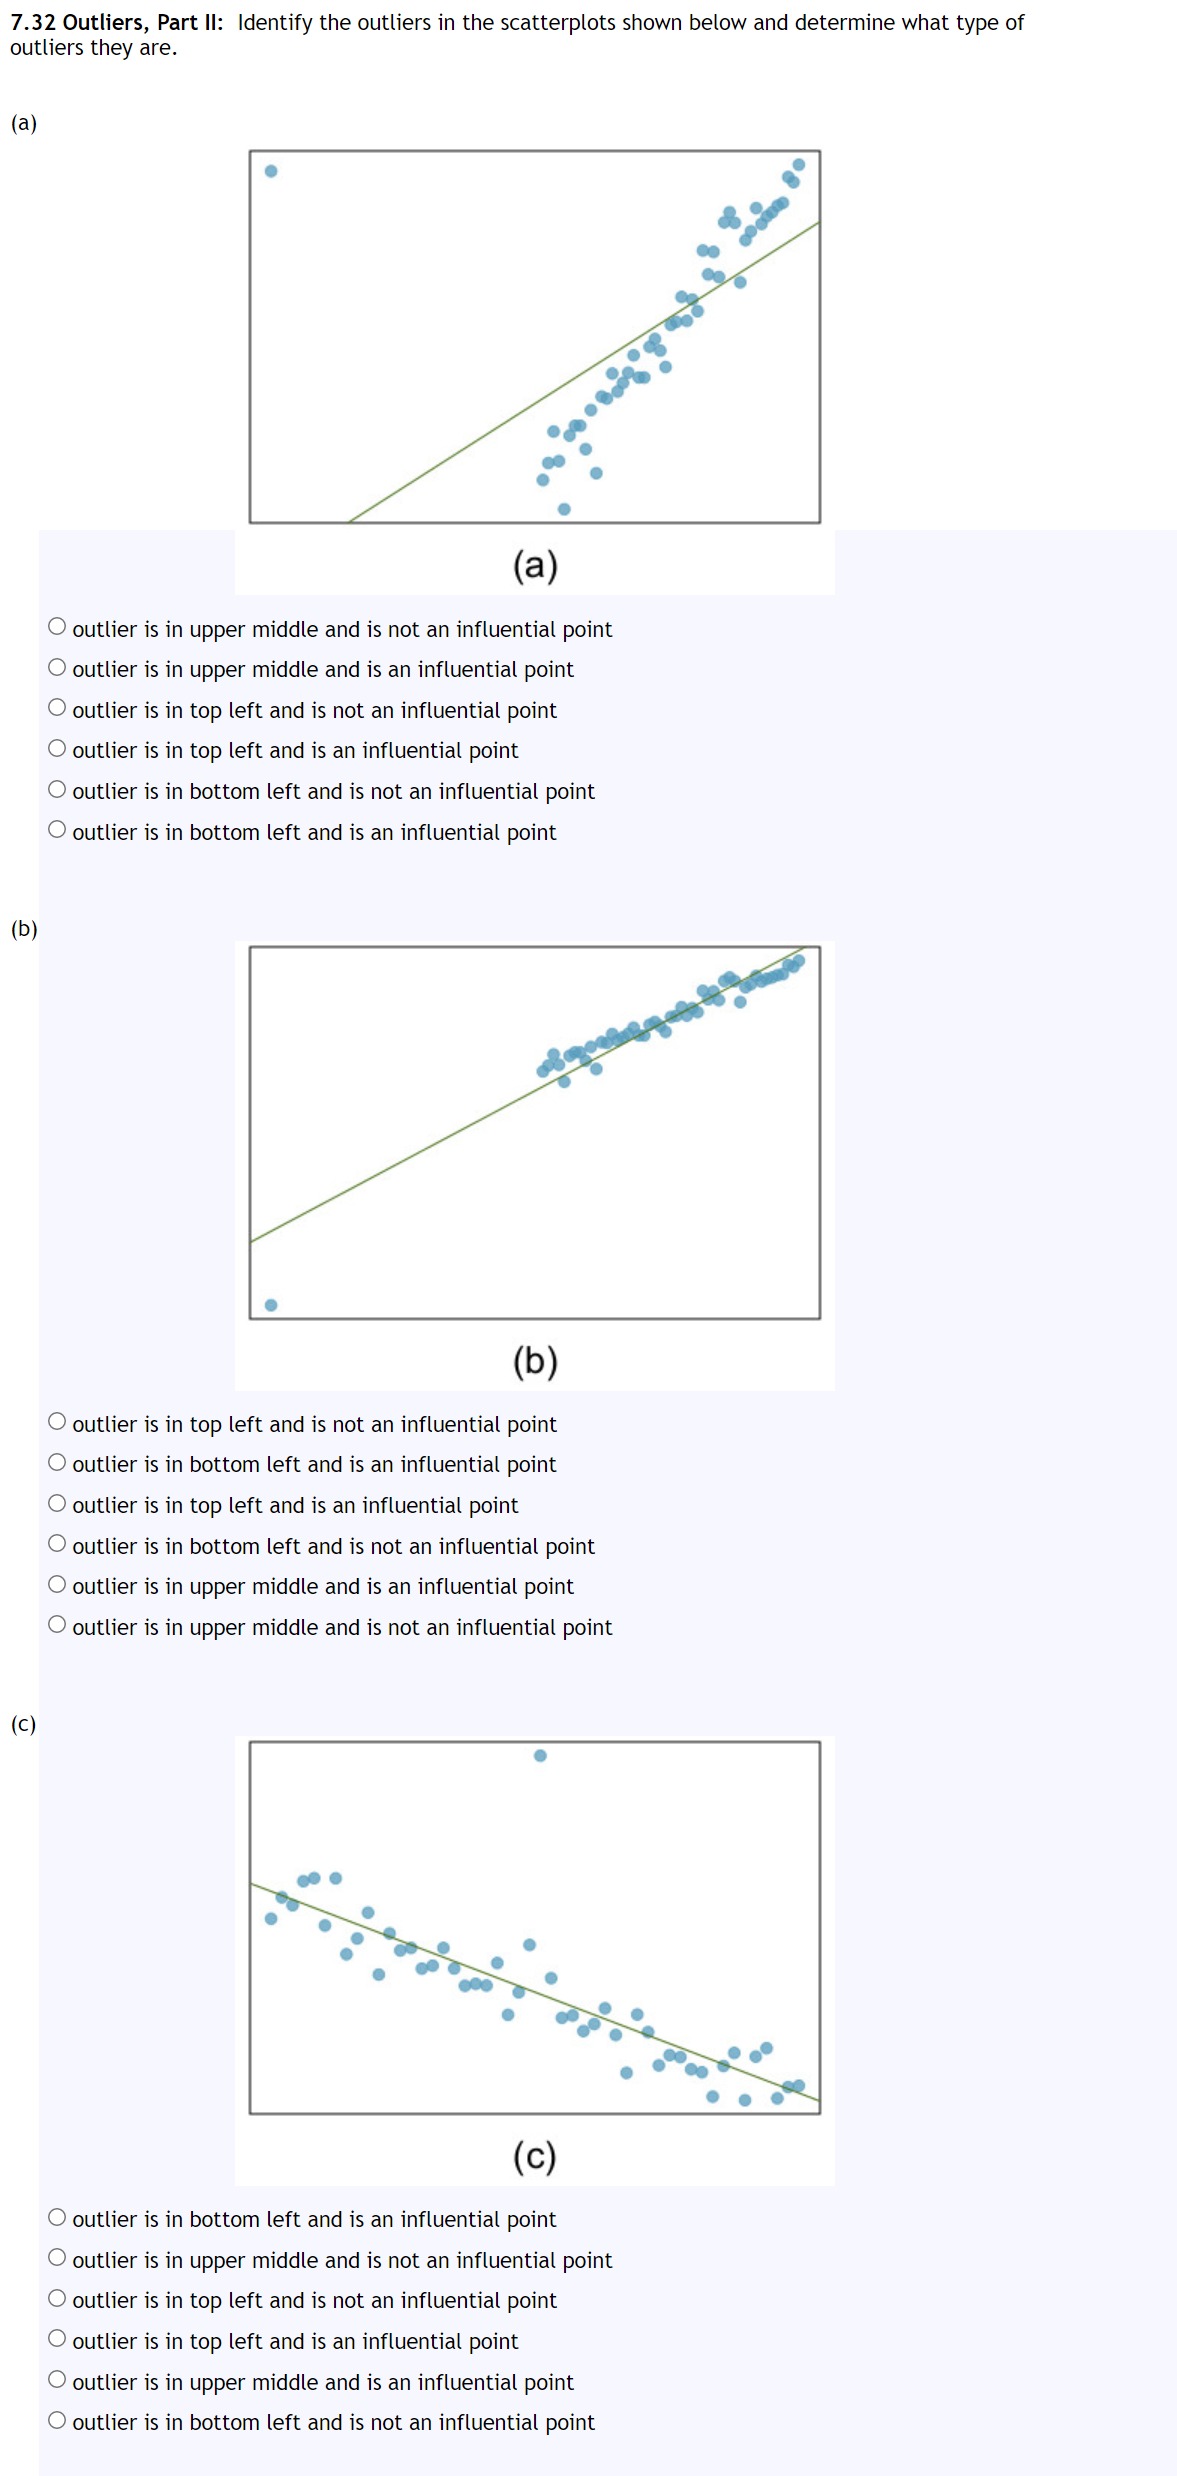
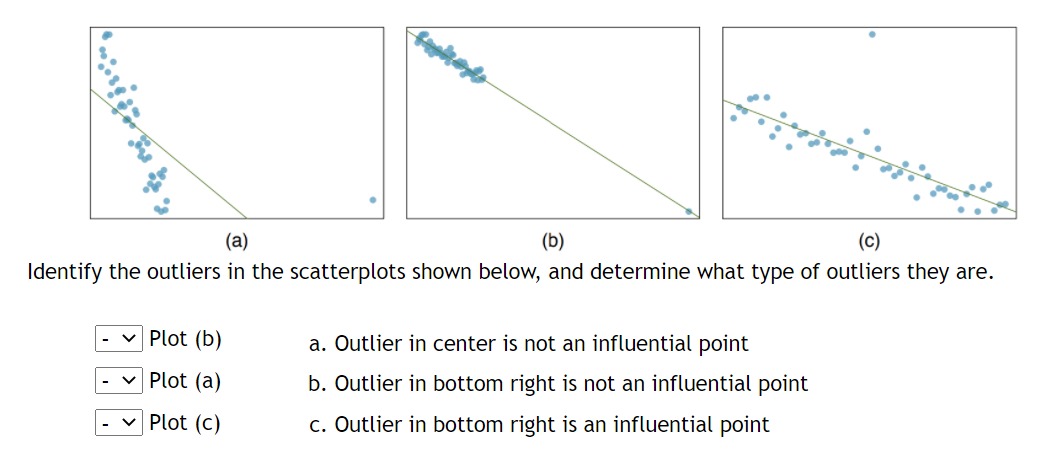
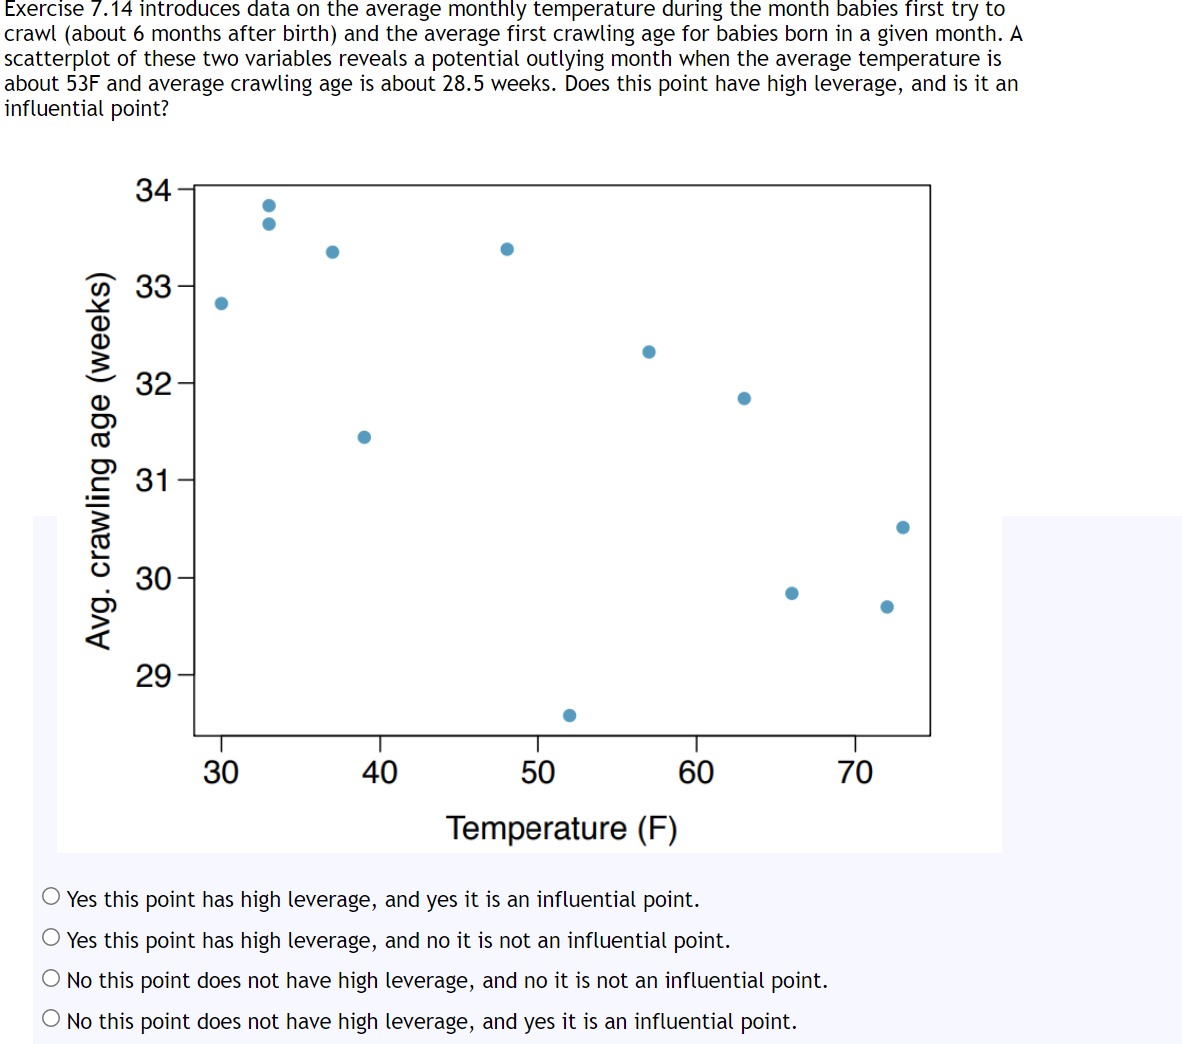
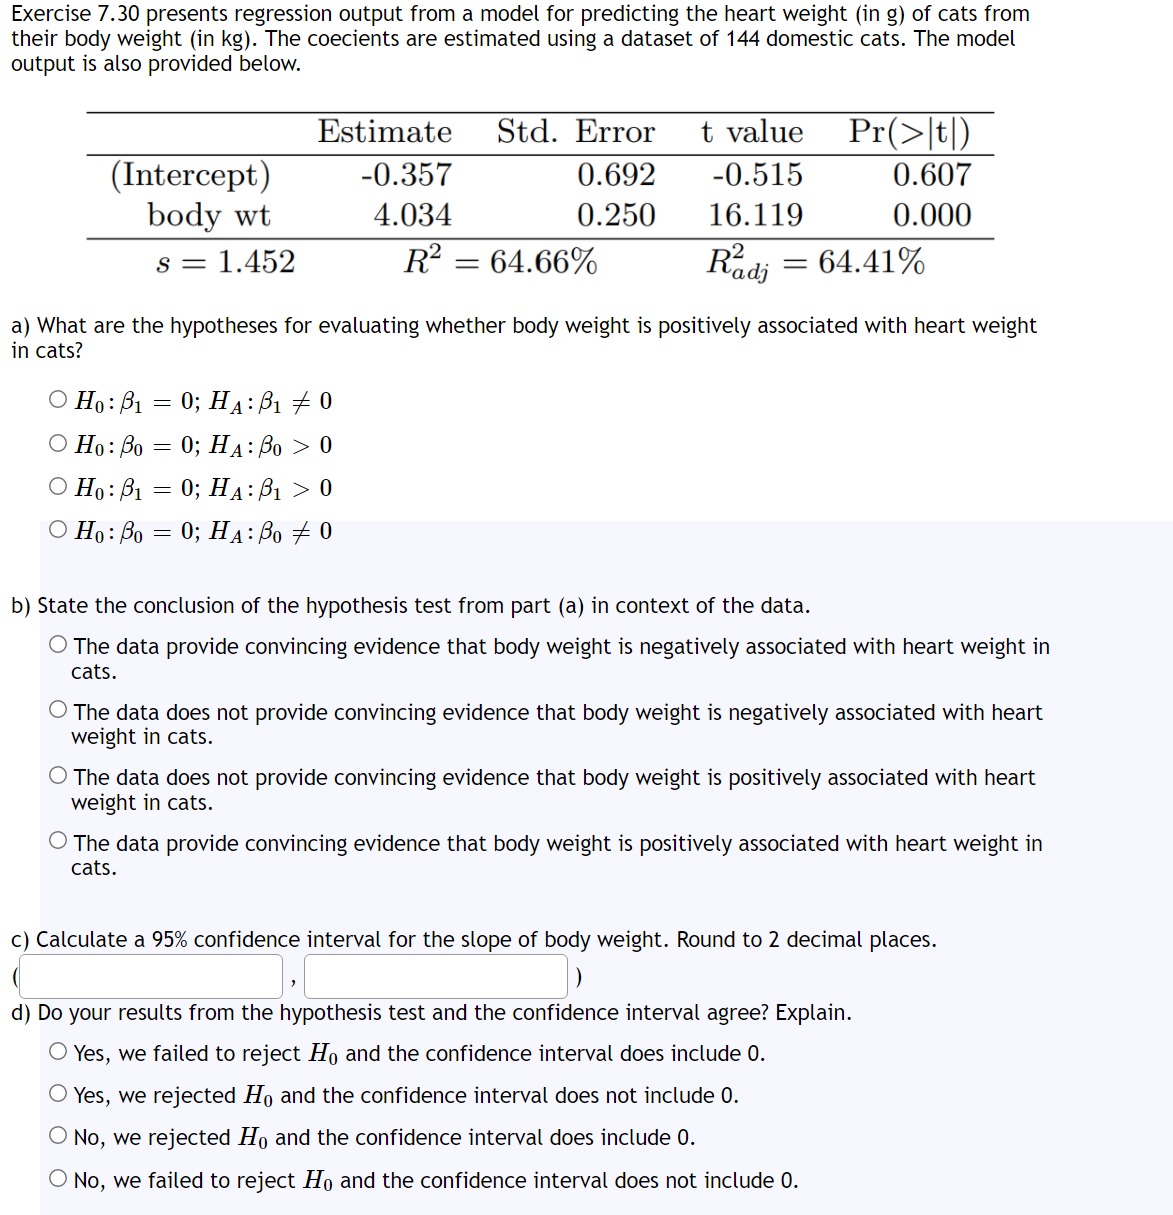
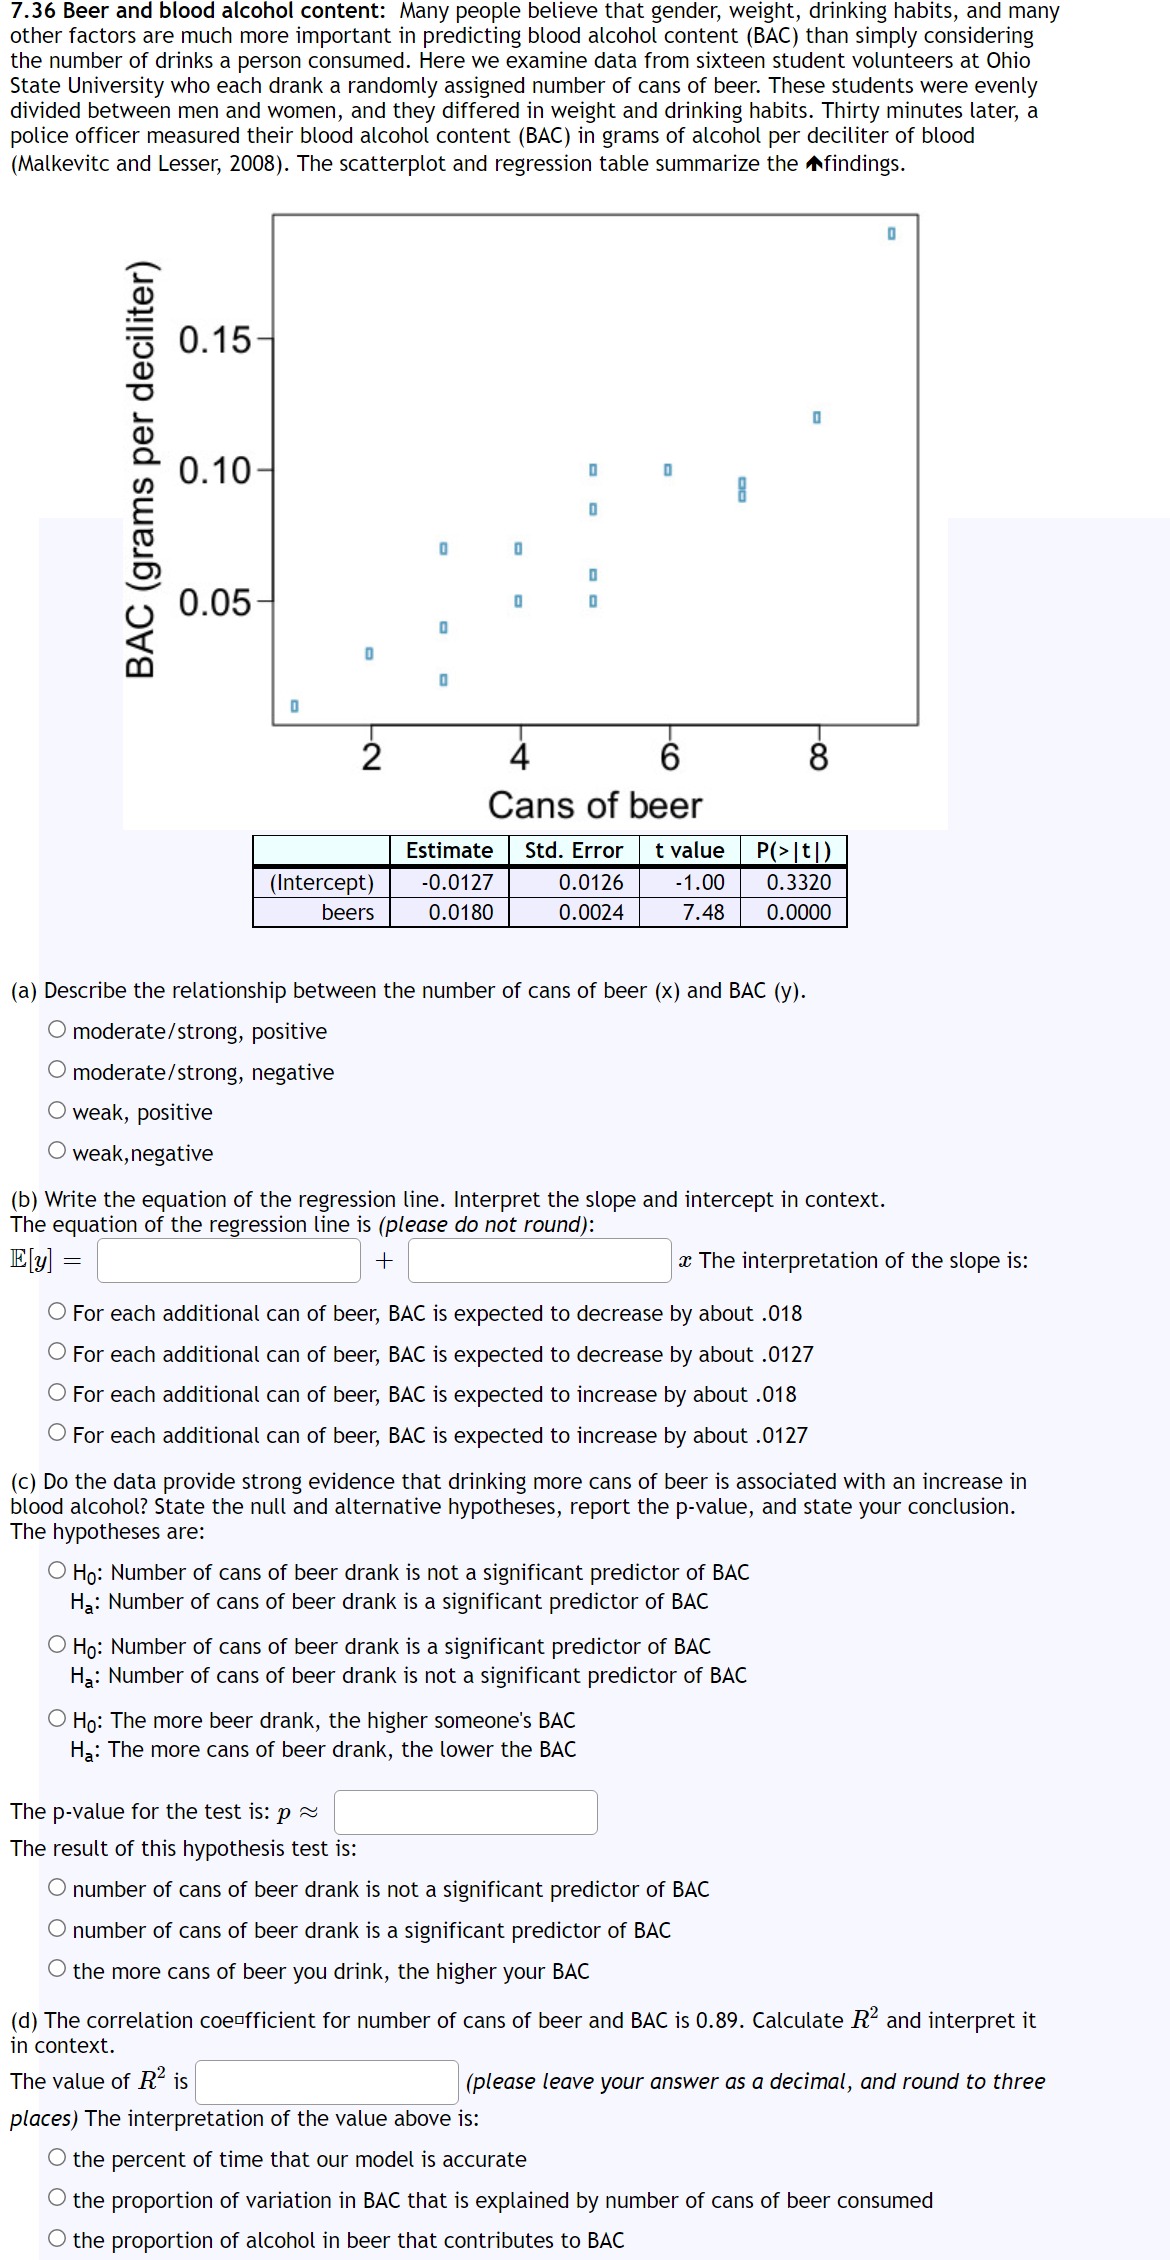
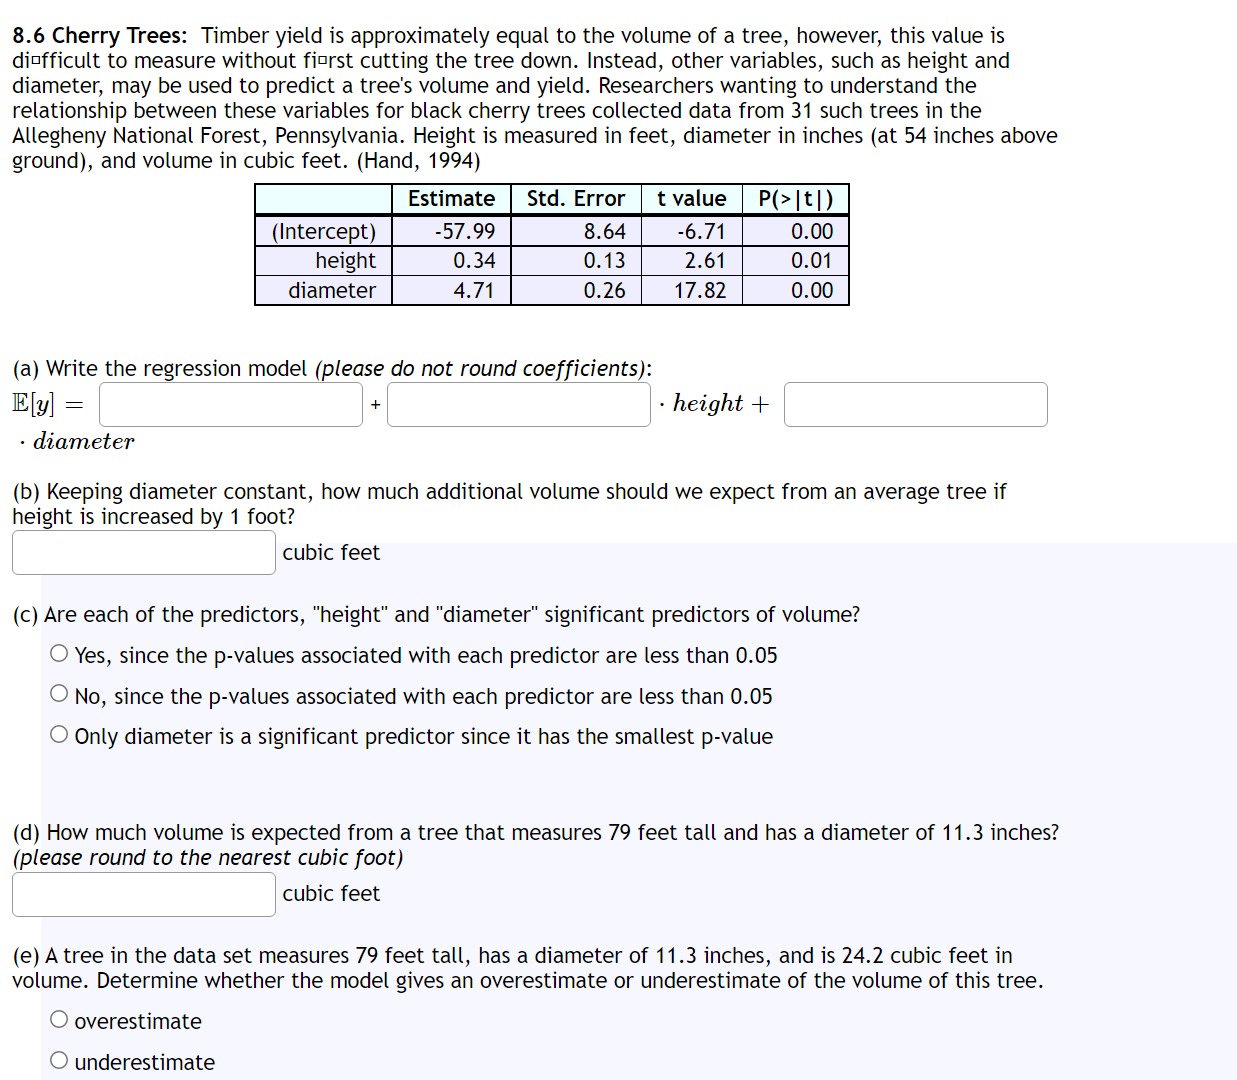
Determine if I or II is higher or if theyr are equal: For a regression line, the uncertainty associated with the slope estimate, u, is higher when I. there is a lot of scatter around the regression line or N. there is very little scatter around the regression line O The}:r are equal 0 II is higher 0 | is higher The scatterplot below shows the relationship between the number of calories and amount of carbohydrates (in grams) Starbucks food menu items contain.21 Since Starbucks only lists the number of calories on the display items, we are interested in predicting the amount of carbs a menu item has based on its calorie content. so 25 .. 2 20 on an E g 15 3 0 40 a 10 0 2o 5 20 500 40 -20 0 2O 40 Calories Residuals a) Describe the relationship between number of calories and amount of carbohydrates (in grams) that Starbucks food menu items contain. 0 There is a negative, moderate, nonlinear association between the number of calories and carbs 0 There is a positive, moderate, nonlinear association between the number of calories and carbs 0 There is a positive, moderate, linear association between the number of calories and carbs 0 There is a positive, weak, linear association between the number of calories and carbs b) In this scenario, what are the explanatory and response variables? 0 Explanatory: calories. Response: residuals O Explanatory: carbs (in grams). Response: calories 0 Explanatory: residuals. Response: carbs (in grams) 0 Explanatory: calories. Response: carbs (in grams) c) Why might we want to fit a regression line to these data? 0 To predict residuals for a given number of carbs 0 To predict number of carbs for a given number of calories 0 To predict number of carbs for a given number of calories 0 To predict residuals for a given number of calories d) Do the data meet the conditions required for fitting a least squares line? In addition to the scatterplot, use the residual plot and histogram to answer this question. 0 Asimple linear model is adequate for modeling these data since the residual plot shows a linear relationship 0 Asimple linear model is inadequate for modeling these data since variability is increasing with calories 0 Asimple linear model is inadequate for modeling these data since the residual plot shows a linear relationship 0 Asimple linear model is adequate for modeling these data since variability is increasing with calories 7.32 Outliers, Part II: Identify the outliers in the scatterplots shown below and determine what type of outliers they are. (a) (a) O outlier is in upper middle and is not an influential point 0 outlier is in upper middle and is an influential point 0 outEier is in top left and is not an influential point 0 outlier is in top left and is an influential point 0 outlier is in bottom left and is not an influential point 0 outlier is in bottom left and is an influential point (13) O outlier is in top left and is not an influential point 0 outlier is in bottom left and is an influential point 0 outlier is in top left and is an influential point 0 outlier is in bottom left and is not an influential point 0 outlier is in upper middle and is an influential point 0 outlier is in upper middle and is not an influential point (C) (C) O outlier is in bottom left and is an influential point 0 outlier is in upper middle and is not an influential point 0 outlier is in top left and is not an influential point 0 outlier is in top left and is an influential point 0 outlier is in upper middle and is an influential point 0 outlier is in bottom left and is not an influential point (a) (b) (c) Identify the outliers in the scatterplots shown below, and determine what type of outliers they are. V Plot (b) a. Outlier in center is not an influential point V Plot (a) b. Outlier in bottom right is not an influential point V Plot (c) c. Outlier in bottom right is an influential pointExercise 7.14 introduces data on the average monthly temperature during the month babies first try to crawl (about 6 months after birth) and the average first crawling age for babies born in a given month. A scatterplot of these two variables reveals a potential outlying month when the average temperature is about 53F and average crawling age is about 28.5 weeks. Does this point have high leverage, and is it an influential point? 34 33 32 31 30 Avg. crawling age (weeks) 29 30 40 50 60 70 Temperature (F) 0 Yes this point has high leverage, and yes it is an influential point. 0 Yes this point has high leverage, and no it is not an influential point. 0 No this point does not have high leverage, and no it is not an influential point. 0 No this point does not have high leverage, and yes it is an influential point. Exercise 7.30 presents regression output from a model for predicting the heart weight (in g) of cats from their body weight (in kg). The coecients are estimated using a dataset of 144 domestic cats. The model output is also provided below. Estimate Std. Error tvalue Pr(>|t|) (Intercept) -O.357 0.692 -0.515 0.607 body wt 4.034 0.250 16.119 0.000 s = 1.452 R2 : 64.66% Rdj = 64.41% a) What are the hypotheses for evaluating whether body weight is positively associated with heart weight in cats? OHM/81 = 0:34:51 7&0 OHDUBO : 0;HA:;30 > 0 OHDUBI : 0;HA:;31 > 0 0301180 = 0:114:30 7&0 b) State the conclusion of the hypothesis test from part (a) in context of the data. 0 The data provide convincing evidence that body weight is negatively associated with heart weight in cats. 0 The data does not provide convincing evidence that body weight is negatively associated with heart weight in cats. 0 The data does not provide convincing evidence that body weight is positively associated with heart weight in cats. 0 The data provide convincing evidence that body weight is positively associated with heart weight in cats. c) Calculate a 95% confidence interval for the slope of body weight. Round to 2 decimal places. ( ) d) Do your results from the hypothesis test and the confidence interval agree? Explain. J 0 Yes, we failed to reject Ho and the confidence interval does include 0. 0 Yes, we rejected H0 and the confidence interval does not include 0. O No, we rejected H0 and the confidence interval does include 0. O No, we failed to reject Ho and the confidence interval does not include 0. 7.36 Beer and blood alcohol content: Many people believe that gender, weight, drinking habits, and many other factors are much more important in predicting blood alcohol content (BAC) than simply considering the number of drinks a person consumed. Here we examine data from sixteen student volunteers at Ohio State University who each drank a randomly assigned number of cans of beer. These students were evenly divided between men and women, and they differed in weight and drinking habits. Thirty minutes later, a police officer measured their blood alcohol content (BAC) in grams of alcohol per deciliter of blood (Malkevitc and Lesser, 2008). The scatterplot and regression table summarize the afindings. 0.15 0.10 0.05 BAC (grams per deciliter) 2 4 6 8 Cans of beer Estimate Std. Error -0.0127 0.0126 -1.00 0.3320 0.01 80 0.0024 (a) Describe the relationship between the number of cans of beer (x) and BAC (y). (Intercept) beers O moderatelstrong, positive 0 moderate/ strong, negative 0 weak, positive 0 weak,negative (b) Write the equation of the regression line. Interpret the slope and intercept in context. The equation of the regression line is (please do not round): EM : l I + I a: The interpretation of the slope is: O For each additional can of beer, BAC is expected to decrease by about .018 O For each additional can of beer, BAC is expected to decrease by about .0127 O For each additional can of beer, BAC is expected to increase by about .018 O For each additional can of beer, BAC is expected to increase by about .0127 (c) Do the data provide strong evidence that drinking more cans of beer is associated with an increase in blood alcohol? State the null and alternative hypotheses, report the p-value, and state your conclusion. The hypotheses are: 0 Ho: Number of cans of beer drank is not a significant predictor of BAC Ha: Number of cans of beer drank is a significant predictor of BAC O Ho: Number of cans of beer drank is a significant predictor of BAC Ha: Number of cans of beer drank is not a significant predictor of BAC O H0: The more beer drank, the higher someone's BAC Ha: The more cans of beer drank, the lower the BAC The p-value for the test is: p m The result of this hypothesis test is: 0 number of cans of beer drank is not a significant predictor of BAC 0 number of cans of beer drank is a significant predictor of BAC O the more cans of beer you drink, the higher your BAC (d) The correlation coeufficient for number of cans of beer and BAC is 0.89. Calculate R2 and interpret it in context. The value of R2 is (please leave your answer as a decimal, and round to three places) The interpretation of the value above is: O the percent of time that our model is accurate 0 the proportion of variation in BAC that is explained by number of cans of beer consumed O the proportion of alcohol in beer that contributes to BAC 8.6 Cherry Trees: Timber yield is approximately equal to the volume of a tree, however, this value is diEIfficult to measure without finrst cutting the tree down. Instead, other variables, such as height and diameter, may be used to predict a tree's volume and yield. Researchers wanting to understand the relationship between these variables for black cherry trees collected data from 31 such trees in the Allegheny National Forest, Pennsylvania. Height is measured in feet, diameter in inches (at 54 inches above ground), and volume in cubic feet. (Hand, 1994) m mm m height 0.34 0.13 2.61 0.01 diameter 4.71 0.26 17.82 0.00 (a) Write the regression model (pleose do not round coefficients); Ely] = l H '-height+| - diameter (b) Keeping diameter constant, how much additional volume should we expect from an average tree if height is increased by 1 foot? [ cubic feet (c) Are each of the predictors, "height" and "diameter" significant predictors of volume? 0 Yes, since the p-values associated with each predictor are less than 0.05 O No, since the p-values associated with each predictor are less than 0.05 0 Only diameter is a significant predictor since it has the smallest p-value (d) How much volume is expected from a tree that measures 79 feet tall and has a diameter of 11.3 inches? (please round to the nearest cubic foot) cubic feet (e) A tree in the data set measures 79 feet tall, has a diameter of 11.3 inches, and is 24.2 cubic feet in volume. Determine whether the model gives an overestimate or underestimate of the volume of this tree. 0 overestimate O underestimate