

Question: The US census collects data on time it takes Americans to commute to work, among many other variables. The histogram below shows the distribution of
The US census collects data on time it takes Americans to commute to work, among many other variables. The histogram below shows the distribution of average commute times in 3,142 US counties in 2010. Also shown below is a spatial intensity map of the same data.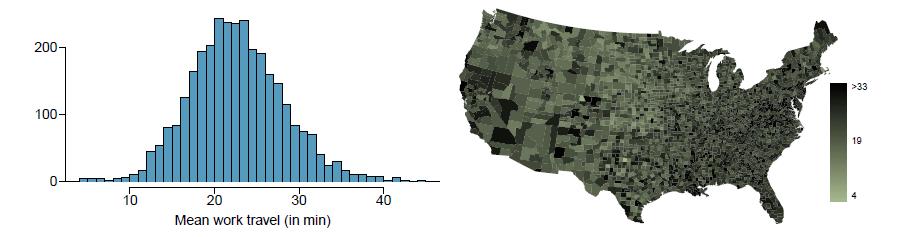
(a) Describe the numerical distribution and comment on whether or not a log transformation may be advisable for these data.
(b) Describe the spatial distribution of commuting times using the map above.
200- 100- 0 10 20 30 Mean work travel (in min) 40 >33 19
Step by Step Solution
3.44 Rating (157 Votes )
There are 3 Steps involved in it
a Numerical Distribution The histogram shows a distribution of average commute times that appears ro... View full answer

Get step-by-step solutions from verified subject matter experts