

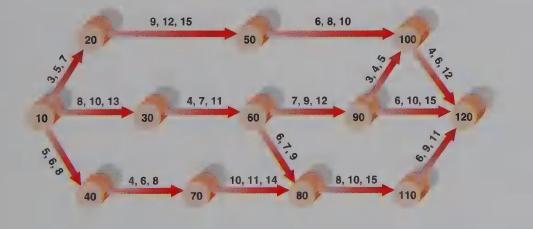
12. A PERT diagram is shown below with the optimistic, most likely, and pessimistic times, in days,...
Question:
12. A PERT diagram is shown below with the optimistic, most likely, and pessimistic times, in days, shown above each arrow.
a. Find ¢, for each activity.
b. Find the slack for each event and find the critical path.
c. What is the expected completion time?
d. What is the probability that the critical path will be completed in 45 days or less?
Fantastic news! We've Found the answer you've been seeking!
Step by Step Answer:

Answered By
ANDREW KIPRUTO
Academic Writing Expert
I have over 7 years of research and application experience. I am trained and licensed to provide expertise in IT information, computer sciences related topics and other units like chemistry, Business, law, biology, biochemistry, and genetics. I'm a network and IT admin with +8 years of experience in all kind of environments.
I can help you in the following areas:
Networking
- Ethernet, Wireless Airmax and 802.11, fiber networks on GPON/GEPON and WDM
- Protocols and IP Services: VLANs, LACP, ACLs, VPNs, OSPF, BGP, RADIUS, PPPoE, DNS, Proxies, SNMP
- Vendors: MikroTik, Ubiquiti, Cisco, Juniper, HP, Dell, DrayTek, SMC, Zyxel, Furukawa Electric, and many more
- Monitoring Systems: PRTG, Zabbix, Whatsup Gold, TheDude, RRDtoo
Always available for new projects! Contact me for any inquiries
1+ Reviews
10+ Question Solved
Related Book For 

Operations Management Providing Value In Goods And Services
ISBN: 9780030262074
3rd Edition
Authors: Dilworth, James B
Question Posted:
