

2. If graphics are available, plot the control limits and the X and R values from the...
Question:
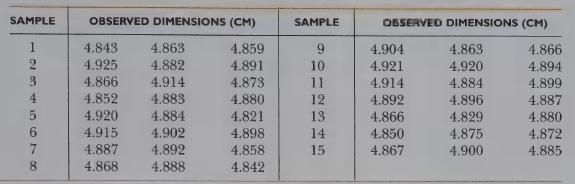
2. If graphics are available, plot the control limits and the X and R values from the samples.
Step by Step Answer:

This question has not been answered yet.
You can Ask your question!
Related Book For 
Operations Management Providing Value In Goods And Services
ISBN: 9780030262074
3rd Edition
Authors: Dilworth, James B
Question Posted:
