The Millers Ice Cream store in Bar Harbor, Maine, is one of the most popular tourist destinations
Question:
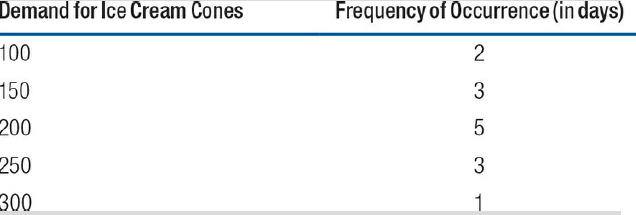
This summer, the owner€™s nephew, Pat, has returned from his university€™s business school with better knowledge of simulation and has set about organizing the ordering system to make it more efficient. After going through the past year€™s sales records, Pat determined that the majority of sales came from ice cream cones and decided to use simulation to estimate the demand for the upcoming summer. Because of the short summer, he chose to analyze sales each two-week period (the typical time between reordering ice cream). His analysis found the following:
Based on this information:
1. Calculate the probability of demand for ice cream across each increment.
2. Using random numbers, simulate demand values across the 14-day period.
3. Calculate the average daily simulated demand for ice cream.
Optional:
4. Use Excel to calculate average daily simulated demand for ice cream.

Step by Step Answer:

Operations Management Managing Global Supply Chains
ISBN: 978-1506302935
1st edition
Authors: Ray R. Venkataraman, Jeffrey K. Pinto


