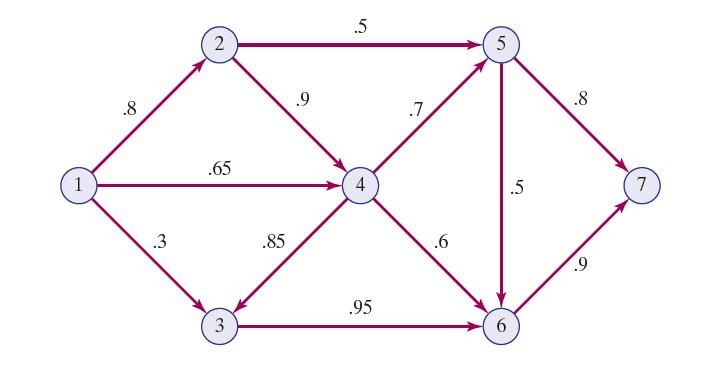
Figure 6.40 provides the communication network between two stations, 1 and 7. The probability that a link
Question:
Figure 6.40 provides the communication network between two stations, 1 and 7. The probability that a link in the network will operate without failure is shown on each arc. Messages are sent from station 1 to station 7, and the objective is to determine the route that maximizes the probability of a successful transmission. Formulate the situation as a shortest-route model, and determine the optimum solution.
FIGURE 6.40
Fantastic news! We've Found the answer you've been seeking!
Step by Step Answer:
Related Book For 

Question Posted:


