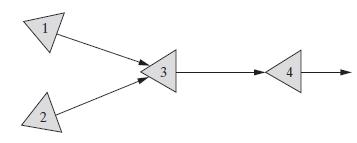
The figure below shows a system of reservoirs and hydroelectric dams of the sort operated by large
Question:
The figure below shows a system of reservoirs and hydroelectric dams of the sort operated by large utilities such as California’s PG&E.
Each node is a reservoir with a power plant releasing water on the downstream side. The water then requires one month to reach the reservoir of the next dam on the river system. Acre-feet inflows bi,t from streams feeding each reservoir i (other than the indicated rivers) can be estimated for coming months t = 1,
c, 3, and reservoirs begin month 1 with storage si,0. Lower and upper bounds si and sQ i restrict the number of acre-feet of water that should be stored in each reservoir i at all times, and similar bounds fi and fi limit the release flow through the dams. The hydropower obtained from any dam i in any month can be estimated by nonlinear function hi1s, f2 reflecting both the flow f through the dam that month and the water pressure, which is a consequence of the amount of water s stored in the corresponding reservoir at the end of the month. Managers would like to operate the system to maximize the total power produced.
(a) Sketch a time-expanded flow network for this problem with arcs fi,t reflecting monthly release flows at i, and other arcs si,t reflecting ending storage there at month t. Label arcs with lower and upper bounds, and nodes with net inflows.
Assume that all releases fi,0 = 0.
(b) Formulate an NLP to maximize the total power produced in your network of part (a).
Step by Step Answer:


