The figure that follows shows the links of a proposed campus computer network. Each node is a
Question:
The figure that follows shows the links of a proposed campus computer network. Each node is a computer, and links are fiber-optic cable.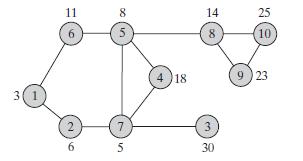
Designers now want to decide how E-mail, which will be broken into standard-length packets, should be routed from Internet gateway node 1 to/from all other nodes. For example, E-mail for node 4 might be transmitted by 1 to 6, then repeated by 6 to 5, then repeated by 5 to 4. Numbers on nodes in the figure indicate minimum times (in nanoseconds) required by the corresponding computer to transmit or receive a message packet.
The time to send a packet along any link of the network is the maximum of the times for the associated sending and receiving computers.
(a) Explain why this problem can be modeled as a shortest path problem, and sketch the graph and edge weights over which optimal paths are to be computed.
(b) Explain why the most efficient procedure available from this chapter for computing optimal E-mail routes is Dijkstra Algorithm 9C.
(c) Apply Algorithm 9C to compute optimal routes to all computers.
Step by Step Answer:

This question has not been answered yet.
You can Ask your question!