

Question: Examine Fig. P. 7.53, which shows three periodic functions and their corresponding Fourier frequency spectra. Discuss the graphs explaining whats happening in successive parts. What
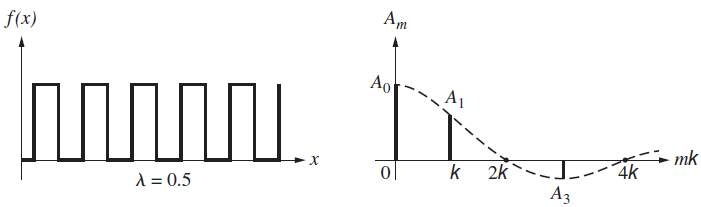
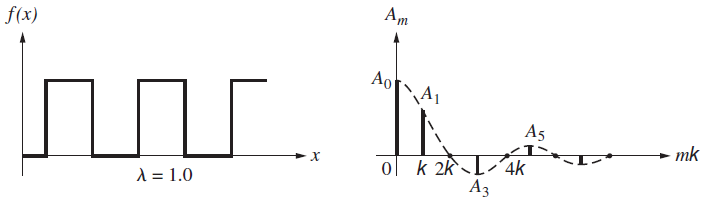
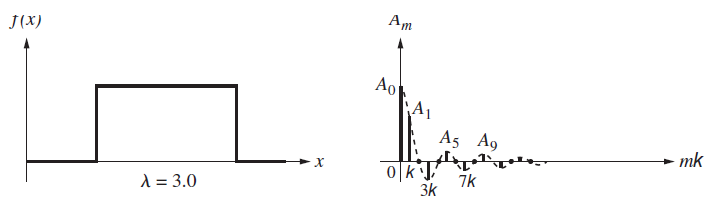
Examine Fig. P. 7.53, which shows three periodic functions and their corresponding Fourier frequency spectra. Discuss the graphs explaining what€™s happening in successive parts. What happens to the envelopes of the frequency spectra as the wavelength increases? Why are the same number of frequency terms present in each spectrum between 0 and, say, 4k? Why is there a DC term in each spectrum and why does it have the same value in all of them? Why are there no terms corresponding to A2, A4, A6, and so forth?
Fig. P. 7.53
a.
b.
c.
f(x) . Ao . A1 * mk 4k 2k A = 0.5 f(x) . . Ao A1 A5 mk ol k 2kL-4k %3D 1.0
Step by Step Solution
3.35 Rating (173 Votes )
There are 3 Steps involved in it
a The envelopes of frequency spectra become more compresse... View full answer

Get step-by-step solutions from verified subject matter experts