9.1 Consider the following data from an experiment testing the effects of 5 levels of application of
Question:
9.1 Consider the following data from an experiment testing the effects of 5 levels of application of potash on the Pressley strength index of cotton (John and Que- nouille, 1977)
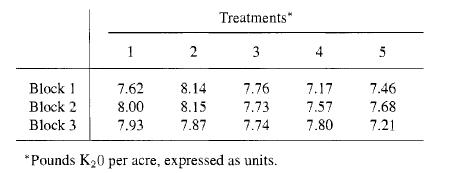
(i) Obtain the ANOVA table and test the hypothesis that there are no differ- ences among the treatments. (ii) Since the treatments are quantitative, rather than making comparisons be- tween individual treatments, it is preferable to explore the response curve. Partition the treatment sum of squares into three components due to lin- ear effects, quadratic effects, and remainder. Test for linear and quadratic effects. (iii) Suppose the actual levels of the treatments are 36, 54, 72, 108, and 144 pounds K20 per acre, respectively. Partition the treatment sum of squares into a component due to linear response and a component due to deviation from linear response. Test for linearity. (iv) Find the relative efficiency of this design and interpret the result.
Step by Step Answer: