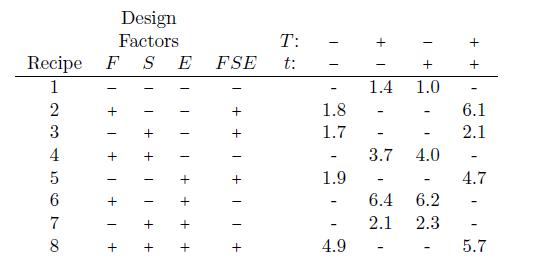
Bisgaard and Kulahci (2001) describe an experiment conducted by a man- ufacturer of boxed cake mixes. The
Question:
Bisgaard and Kulahci (2001) describe an experiment conducted by a man-
ufacturer of boxed cake mixes. The manufacturer wanted to nd a way to make the recipe more robust so that if customers bake at a slightly dierent temperature or time from that recommended on the box, the cake would still taste good. The manufacturer varied F: the amount of our, S: the amount of shortening, and E: the amount of egg powder in the recipe. These factors were varied according to a 23 design illustrated in the left-hand side of the table above. For each of the eight recipes, a large batch of dough was made. From each dough batch two cakes were baked, one at each of the T: temperature and t: time conditions listed across the top of the table. Since a dierent combination of levels of T: temperature and t: time were used depending on the sign of FSE, it can be seen that split-plot confounding was utilized. There were 16 cakes baked in total representing a 25−1 frac-
tion. The responses shown in the table below are averages of scores between 1 and 7 obtained from a taste panel. The higher the score the better.
(a) What is the generator and dening relation for this design?
(b) List the estimable eects and their aliases.
(c) Separate the list of estimable eects into two subgroups: rst the group that would be tested with whole-plot error and second the group that would be tested with sub-plot error.
(d) Use the R lm function to calculate the 15 estimable eects.
(e) Modify the R code in Section 8.5.2 to produce separate normal plots of the whole-plot eects and sub-plot eects. Does anything appear to be signicant?
(f) Interpret any signicant main eects and interactions using an interac-
tion plot if needed.
Step by Step Answer:

Design And Analysis Of Experiments
ISBN: 9780471661597
6th International Edition
Authors: Douglas C. Montgomery


