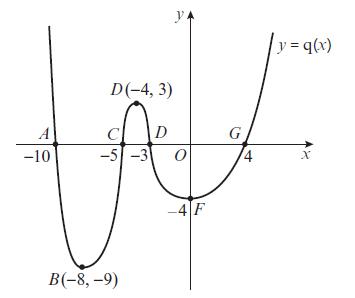
The diagram shows the graph of y = q(x) with 7 points labelled. Sketch each of the
Question:
The diagram shows the graph of y = q(x) with 7 points labelled. Sketch each of the following graphs, labelling the points corresponding to A, B, C, D and E, and any points of intersection with the coordinate axes.
a. y = |q(x)|
b. y = q(|x|)
Fantastic news! We've Found the answer you've been seeking!
Step by Step Answer:
Related Book For 

Pearson Edexcel A Level Mathematics Pure Mathematics Year 2
ISBN: 9781292183404
1st Edition
Authors: Greg Attwood, Jack Barraclough, Ian Bettison, David Goldberg, Alistair Macpherson, Joe Petran
Question Posted:


