

Question: The velocity of a car increases with time as shown in the graph. a. What is the average acceleration between 0 seconds and 4 seconds?
The velocity of a car increases with time as shown in the graph.
a. What is the average acceleration between 0 seconds and 4 seconds?
b. What is the average acceleration between 0 seconds and 8 seconds?
c. Is the result in part c equal to the average of the two values in parts a and b? Compare and explain.
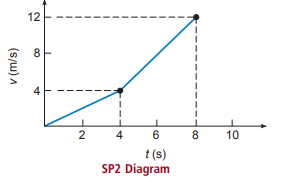
12 8 4 8 10 t (s) SP2 Diagram (s/w) A
Step by Step Solution
3.49 Rating (162 Votes )
There are 3 Steps involved in it
Average acceleration is the change in velocity divide by the time required to produce that change Th... View full answer

Get step-by-step solutions from verified subject matter experts
Document Format (2 attachments)
1575_60619c5a66732_743748.pdf
180 KBs PDF File
1575_60619c5a66732_743748.docx
120 KBs Word File