

Question: a. Sketch graphs of the probability density | ( x ) | 2 | ( x ) | 2 for the four states
a. Sketch graphs of the probability density for the four states in the finite potential well of Figure 40.14a. Stack them vertically, similar to the Figure 40.14a graphs of .
b. What is the probability that a particle in the state of the finite potential well will be found at the center of the well? Explain.
c. Is your answer to part b consistent with what you know about standing waves? Explain.
Figure 40.14a:
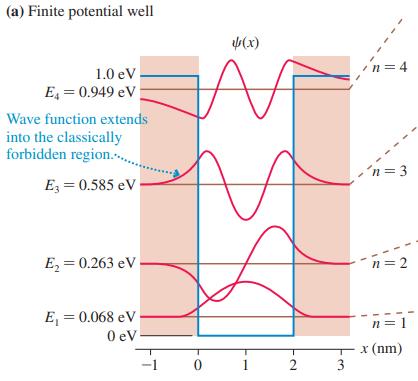
(a) Finite potential well 1.0 eV E = 0.949 eV Wave function extends into the classically (x) n=4 forbidden region... E3 = 0.585 eV 'n=3 E = 0.263 eV E = 0.068 eV 0 eV- n = 2 n = 1 x (nm) -1 0 1 2 3
Step by Step Solution
3.39 Rating (158 Votes )
There are 3 Steps involved in it

Get step-by-step solutions from verified subject matter experts