

Question: FIGURE EX39.14 is a graph of |(x)| 2 for an electron. a. What is the value of a?b. Draw a graph of the wave function
FIGURE EX39.14 is a graph of |ψ(x)|2for an electron.
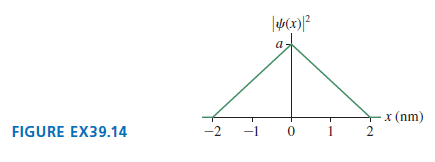 a. What is the value of a?b. Draw a graph of the wave function ψ(x). (There is more than one acceptable answer.)c. What is the probability that the electron is located between x = 1.0 nm and x = 2.0 nm
x (nm) 2 FIGURE EX39.14 -2 1
Step by Step Solution
★★★★★
3.14 Rating (159 Votes )
There are 3 Steps involved in it
1 Expert Approved Answer
Step: 1 Unlock

Model The probability of finding a particle is determined by the probabilit... View full answer
Question Has Been Solved by an Expert!
Get step-by-step solutions from verified subject matter experts
Step: 2 Unlock
Step: 3 Unlock