

Question: FIGURE EX39.16 shows the wave function of a neutron. a. What is the value of c? b. Draw a graph of |Ï(x)| 2 . c.
FIGURE EX39.16 shows the wave function of a neutron.
a. What is the value of c?
b. Draw a graph of |ψ(x)|2.
c. What is the probability that the neutron is located between x = -1.0 mm and x = 1.0 mm?
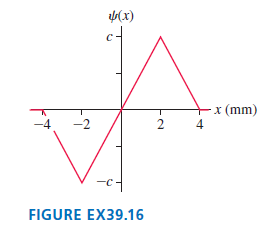
(x) x (mm) 4 -4 -2 FIGURE EX39.16 2.
Step by Step Solution
★★★★★
3.35 Rating (170 Votes )
There are 3 Steps involved in it
1 Expert Approved Answer
Step: 1 Unlock

Model The probability of finding the particle is determined by the probability density Px x 2 ... View full answer
Question Has Been Solved by an Expert!
Get step-by-step solutions from verified subject matter experts
Step: 2 Unlock
Step: 3 Unlock